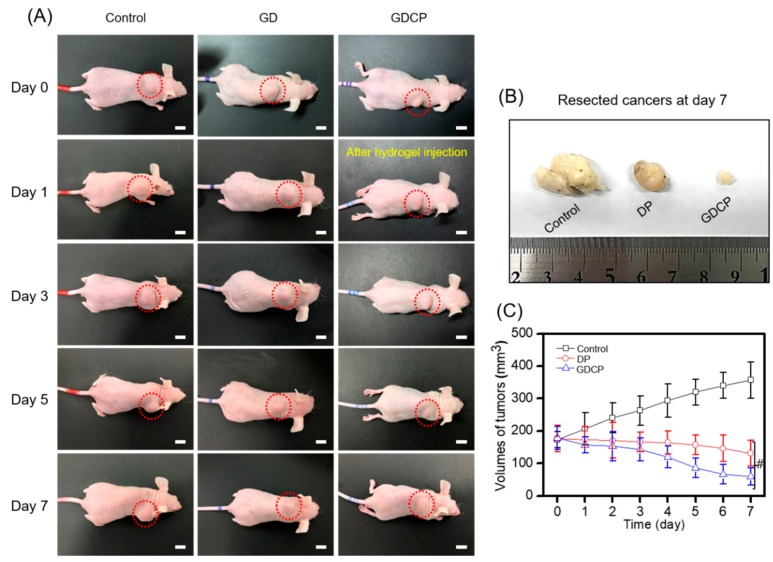
Figure 4.
(A) Gross appearances of cancers bearing to the backs of control and DOX⋅HCl/PTX- and GDCP-treated mice observed before intravenous injection, and at Day 1, 3, 5, and 7 after the injection. (B) Cancer resected from control and DOX⋅HCl/PTX- and GDCP-treated mice at Day 7. (C) Volumes of tumors in control and DOX⋅HCl/PTX- and GDCP-treated mice (#p < 0.05). These values were expressed as the mean ± standard deviation. Scale bar indicates 1 cm.

