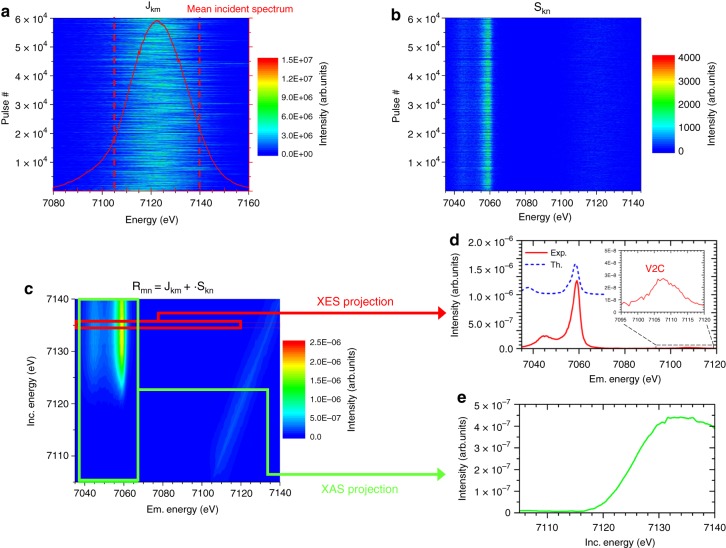
Fig. 2.
Example of the reconstruction of the two-dimensional spectroscopy map of the Kβ line. Using the spectral distribution of 60,000 incident SASE pulses a and of the corresponding XES produced by the broadband incident radiation b, the RXES map can be successfully reconstructed c using a matrix inversion formalism as indicated by the elastic scattering feature in the map and the XES d, which is compared to a multiplet calculation, and XAS spectra which can be extracted e. This methodology alleviates the requirement for monochromatic radiation to measure the RXES map allowing for increased efficiency of such measurements

