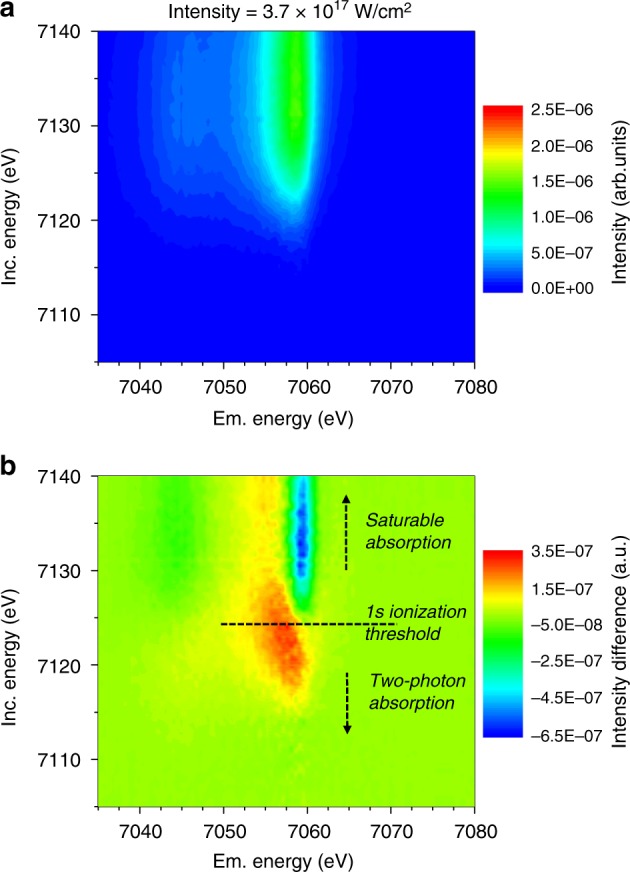
Fig. 3.

Reconstructed RXES maps for different incident intensities. The reconstructed RXES maps for the highest average X-ray intensity of the SASE pulses on the sample a and the difference map b towards the measurement at the lowest intensity, that is the RXES map from Fig. 2, c, are shown. In the vicinity of the core shell ionization threshold noticeable changes, with relative intensity differences of up to +17% and −32% can be observed. Notably a shift in the 1s ionization threshold and a change in the intensity ratio between the Kβ1,3 and the Kβ′ emission lines, representative for the 3p-3d spin-coupling splitting, can be observed
