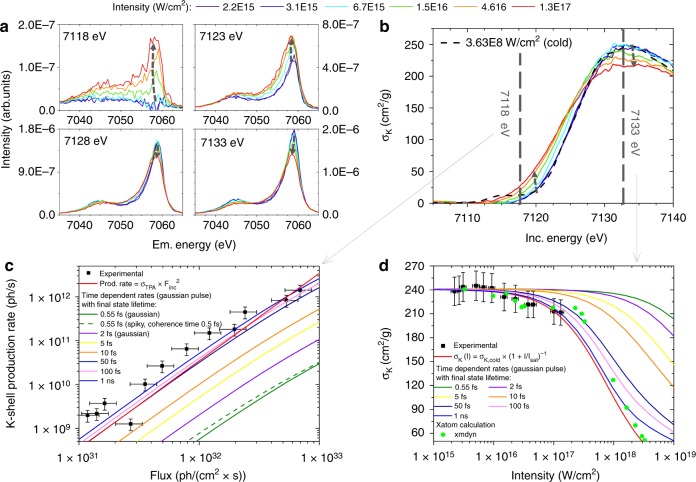
Fig. 4.
K-edge XAS and Kβ XES data showing the SA response and the increased below-edge opacity. The XES signal a reveals a change in the spin state of Fe2O3 with increasing incident X-ray intensity whereas the XAS behavior b exhibits an increased opacity below and higher transparency above the ionization threshold. Further, the TPA cross-sections for a below ionization threshold energy at 7118 eV c and the saturation intensity above the ionization threshold at 7133 eV d were derived from the recorded incident photon-energy dependent data on the K-shell production rate, respectively the photoionization cross-section. The experimental data are plotted along with the theoretical functions (red solid lines) and the rate equation calculations for both smooth Gaussian distribution (solid lines) and a spiky pulse structure (green dashed line) as well as the Xmdyn calculations on SA (green dots)

