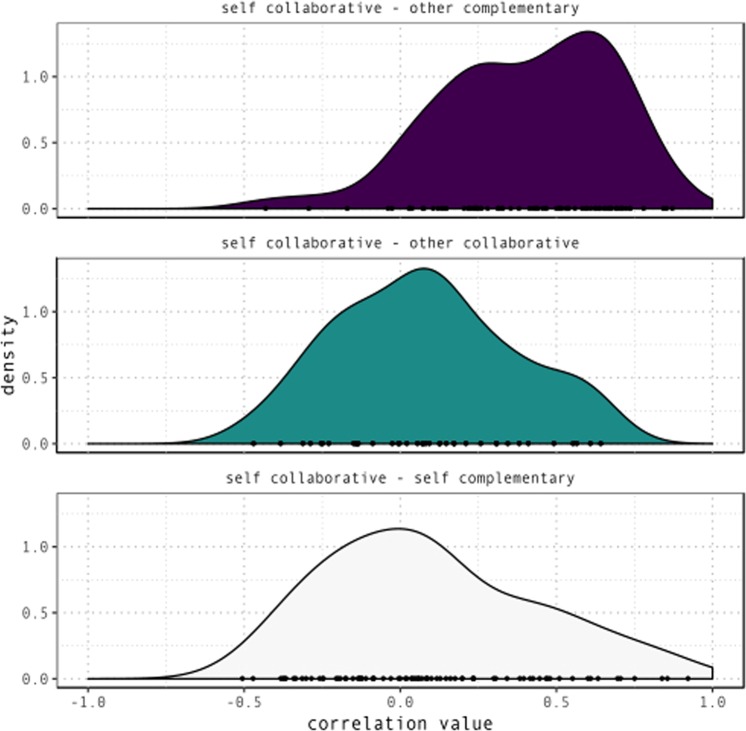
Figure 10.
Density distributions of correlation between proportion of proximal demonstratives for each RelativeX-RelativeY value combination in the collaborative condition, and proportion of proximal demonstratives for their partner in the complementary condition (top), their partner in the collaborative condition (middle), themselves in the complementary condition (bottom). Higher correlation values denote higher similarity in coding of space as proximal vs. distal across participants and conditions.

