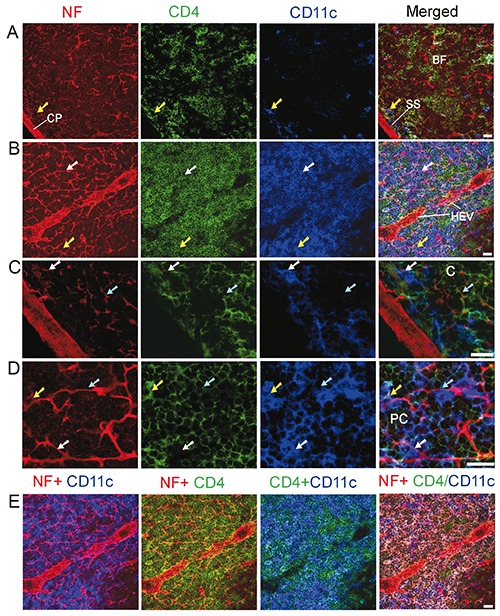
Figure 3.

Distribution of nerve fibres, CD4+ T helper cells, and DCs in the cortex (A,C) and paracortex (B,D,E) of the mesenteric lymph node of a C57BL/6 mouse. Antibodies against NF-H (red), CD4 (green), and CD11c (blue) label mainly nerve fibres, T helper cells, and DCs, respectively. The cyan arrows show CD4+ T helper cells that have a close association with the nerve fibres. The white arrows show CD4-CD11c+ DCs that have a close association with the nerve fibres. The yellow arrows indicate CD4+CD11c+DCs that have a close association with the nerve fibres. A,B) All images are generated by using maximum intensity projection of 13 optical slices; stack size: 6.0 μm; optical slice interval: 0.5 μm. C,D) Images in (C) and (D) are high-resolution views of cropped regions of single optic slice from image sequence of (A) and (B), respectively. E) Combinations of 2 or 3 channels shown in (B). The image in the fourth panel is generated by merging Image I [the red channel (NF)] with Image II (product of colocalization analysis of green and blue channels). The CD4+CD11c+ DCs appear white on this image. C, cortex; CP, capsule; BF, B cell follicle; SS, subcapsular sinus; HEV, high endothelial venules; PC, paracortex. Objective lens: 40x; scale bar: 20 μm.
