
Figure 2.
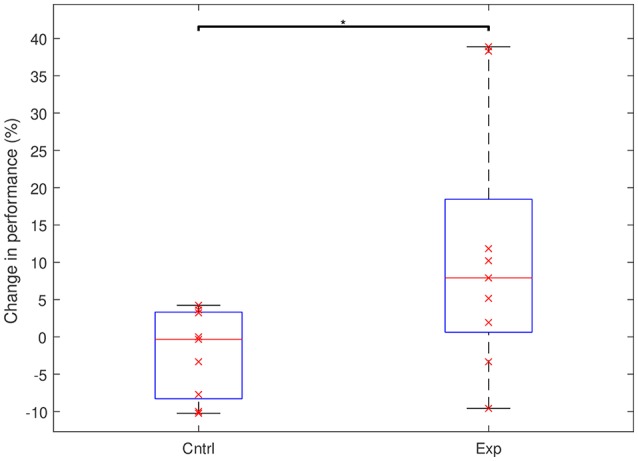
Performance changes in the control and the experimental groups between the start of day 2 and the end of day 4. The groups show a significant difference in behavior (*p < 0.05). On each box, the horizontal red line marks the median and the edges of the box are the 25th and 75th percentiles. Whiskers are capped at max. of 1.5 the IQR. The x's represent individual subjects.