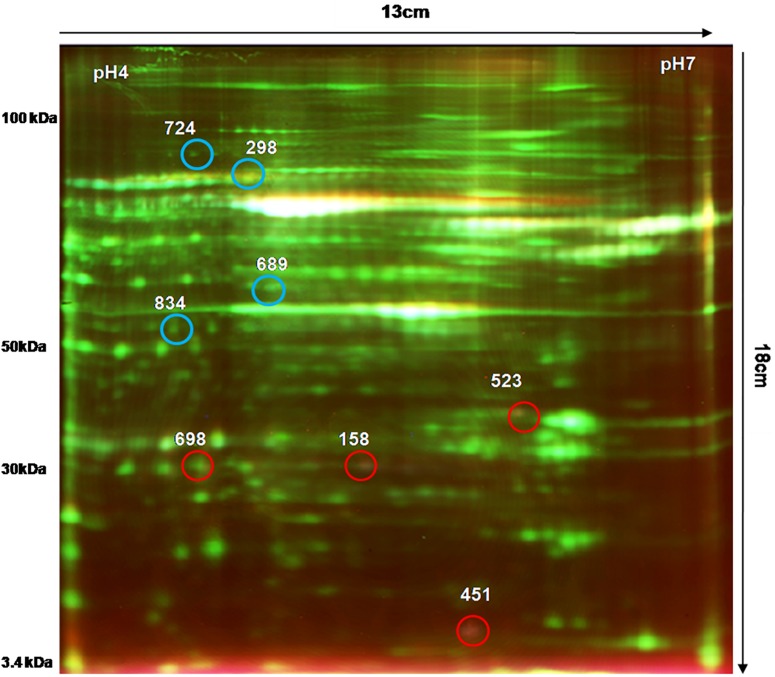
FIGURE 2.
2D-DIGE image of PBMC proteins obtained from FRDA patients and healthy controls. Comparative PBMC proteomics of FRDA patients (n = 6) and age- and gender-matched healthy controls (n = 6) was done on 13-cm-long, pH 4–7 IPG strips using Cy3 (50 μg), Cy5 (50 μg), and pooled internal standard (50 μg). A total of 150 μg of total PBMC protein was used for isoelectric focusing (IEF) followed by second-dimension electrophoresis on SE 600 Ruby gel apparatus using 12.5% SDS-PAGE gel (16 × 13 cm) in dark. Gels were scanned by Typhoon variable mode imager for each Cy dye. Blue circles show protein spots that were up-regulated, and red circled spots were down-regulated in FRDA patients compared with matched healthy controls.

