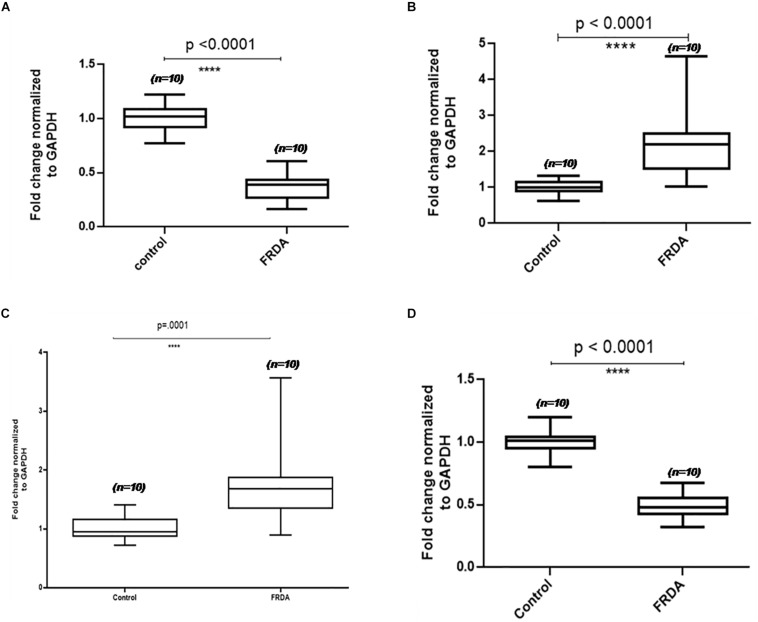
FIGURE 3.
Validation results of four differentially expressed PBMC proteins in FRDA using qPCR. Box-and-whiskers plots of mRNA levels of (A) actin alpha cardiac muscle (ACTC1), (B) caspase 8 (Cas8), (C) serotransferrin (TF), and (D) pyruvate dehydrogenase subunit E1 (PDHE1) in PBMC of FRDA patients and controls. The ends of the whiskers show the position of the lowest and highest quartiles of the data while the edges and line in the center of the box show the upper and lower quartiles. Line inside the box represents the median value (p < 0.001) obtained using Mann–Whitney U test.

