

Abstract
Background:
Despite increasing availability of three-dimensional imaging modalities for estimating right ventricular (RV) size, linear and two-dimensional measures of RV size are the most universally accessible clinical methods. Right ventricular end-diastolic area (RVED area) is known to identify pulmonary pathologies and have prognostic value for cardiovascular mortality in various disease states. To date, there is a paucity of adequately powered studies to define gender‐ and ethnicity-related differences in normal RVED area. Therefore, we derived gender-based normative values for echocardiographic measurements of RVED area, in a large bi-racial cohort of young adults.
Methods:
Healthy young adults participants (n = 2088) in the Coronary Artery Risk Development in Young Adults (CARDIA) study, aged 23–35 years, at the time of echocardiogram, were evaluated. RVED area was stratified according to gender and race. The contributions of clinical, allometric and left heart morphology and function to the variability in RVED area were determined. Results: RVED area in males was significantly larger than in females of similar age, but whites had similar values compared to same-gender blacks. RVED area for men and women of >24.7 cm2 and 20.7cm2, or RVED area indexed to BSA (cm2/m2) of >12.6 and >11.7, respectively, are at the 97.5th percentile of normal values. RVED area correlated significantly with left ventricular volume and left atrial size. Lung capacity measured as FVC showed significant body size adjusted correlation with RVED area only in black males. Conclusions: This study provides normative values for echocardiographically defined RV end-diastolic area, and highlights the necessity to use gender-specific normative values.
Keywords: right ventricular size, normative values, gender-specific
Right ventricular (RV) enlargement occurs in response to RV dysfunction and results from pathologies related to RV volume or pressure overload.1, 2 RV volume measurements necessitates the use of various geometric algorithms about which there is currently no consensus, due to its complex shape.3, 4 Magnetic resonance imaging (MRI) considered the gold standard method for quantifying RV size is now reasonably approximated by three-dimensional (3D) echocardiography.5 In clinical practice, MRI and 3D echocardiography are less accessible and feasible than the standard transthoracic echocardiographic (echo) study.
Clinicians routinely assess RV size visually, by linear dimensions such as RV diameter or right/left ventricular end-diastolic dimension ratio (RV/LV ratio),6 or by two-dimensionally (2D) derived RV area. Clinical studies have shown echo RVED area and MRI RV volume to be highly correlated.7, 8 Animal studies show similar correlation under various loading conditions.9 The RV/LV end-diastolic area ratio is reportedly associated with survival in patients with dilated cardiomyopathy.10, 11 The reference range for echo RV end-diastolic area currently adopted by major societies, including the American Society of Echocardiography,12 was determined from a sample size of 41 individuals.13 There is a paucity of data from large patient cohorts on gender‐ and ethnicity-related differences in this simple and powerful measurement of RV size.
Objective:
The singular aim of this study is to establish normal gender and race-based reference ranges for 2D echo measurements of RVED area, using data obtained from a large biracial cohort of healthy young adults from the Coronary Artery Risk Development in Young Adults (CARDIA) study who have been well characterized with regard to clinical, anthropometric, physiologic, and demographic characteristics.
Methods:
Study Sample:
The CARDIA study is an NIH-sponsored multicenter longitudinal study in young adults designed to assess the relationship between lifestyle and cardiovascular risk factors. Participants were 23–35 years old, including approximately equal proportions of black and white men and women at the time of the year 5 examinations (1990 through 1991). Of 4,352 participants who attended the Year 5 examination, 4,243 had echocardiography performed.
The distribution of RVED area was evaluated in all participants stratified by race and gender. A subgroup was identified for a secondary analysis of the upper limits of RVED area in clinically defined normal participants. For the purpose of this secondary analysis, normal subjects were defined as participants with the following characteristics: (1) normal morphometric measures of diastolic function [defined as: left atrial volume index of <28 m/m2; LV ejection fraction >50%; LV mass height index <50 gm/m2.7]; (2) nonsmoker with forced expiratory volume of >80% predicted; (3) no diabetes, hypertension or obesity—defined as body mass index of >30 g/m2, and free of cardiovascular events from enrolment to the time of the Year 5 echo assessment; and (4) absence of significantly increased mean pulmonary artery pressure—defined as pulmonary artery acceleration time of <70 milliseconds.14 The clinical and demographic characteristics were compared in this “normal” and the overall group. We also identified a subset of participants with high physical fitness (defined as >15 METS achieved in males and >13 METS in females) based on treadmill exercise test performed at both year 0 and year 7 examinations. The mean ± SD of RVED area among these highly fit subjects was determined.
Echocardiography:
Echocardiographic Measurements:
The design, collection, and analysis of digitally captured frames from video recordings of the echocardiographic studies has been previously described.15 The RVED area was traced from images obtained in the apical four-chamber view, from one representative cardiac cycle in which more than 80% of the endocardium was visualized. RV diastolic area was traced beginning at the lateral tricuspid annular ring, clockwise to the membranous septum. Measurements of LA and LV dimension, volume, mass and systolic and diastolic function were performed as previously described.16 Pulmonary artery acceleration time was derived from an average of two beats as the interval in milliseconds between the onset of ejection and peak of the pulmonary outflow velocity spectra.15 All reported measurements are based on the original analysis of the echocardiography core laboratory which also assigned a quality score of Excellent, Good, Fair, or Poor in each participant to the apical four-chamber cineloops (from which measurements of LV biplane volumes and RVED area were obtained).
Analysis:
We compared year 5 demographics between those in whom RVED area measurements were available and those with missing measurements to determine how representative of the total CARDIA cohort the analyzed group was. Furthermore, we compared the quality scores for the apical four-chamber view between participants with available RVED area data and those with missing RVED area data. We also compared the image quality score for participants in the upper 20th percentile of BSA among those with or without RV data to determine the influence of body surface area (BSA) on feasibility of RVED area measurement. Pulmonary artery acceleration time of <70 ms and 70–110 ms was used to define severe and mild pulmonary hypertension respectively and proportions were compared by X2 analysis. Gender‐ and race-specific empirical centiles of RVED area were determined. Correlations between selected clinical, morphometric, echo and pulmonary function covariates and RVED area were determined in each gender–race subgroup. Next, partial correlation coefficients adjusting for height, for weight, and for both were determined. Regression models incorporating the variables height, weight, body surface area, body mass index, LV diastolic diameter, LV volume, LA volume, LV mass, vital lung capacity and % predicted forced expiratory volume in one second (PFEV) were used to assess their independent associations with RVED area. The degree of variability in RVED area explained by these covariates was determined from linear regression analyses and expressed by the R2.
The distribution of RVED area in the clinically “normal” subset of 735 participants was compared with the overall distribution to determine the extent of overlap between the “normal” and overall largely asymptomatic cohort. The mean ± standard deviation, and the 95% reference limits for RVED area indexed to body surface area and to height were determined in the “normal” subset.
Results:
Of the 4,243 participants who had echocardiography performed, 2,155 (51%) were missing the measurement for RVED area because RV assessment was not a priority objective of the CARDIA study. This analysis is based on the 2,088 participants for whom RVED was measured. Table I shows baseline characteristics of the overall cohort. Systolic blood pressure, LV mass and LA area were higher in black men than in white men whereas FEV1and FVC were higher in white than black men. A similar difference was seen between white and black women. Cardiac morphometric measurements were lower in women relative to men. Overall, LV mass index was higher in men than women whereas LV volumes were smaller in women. A history of asthma was found in 10–15% overall of participants, but was more prevalent (15.1% and 16%, respectively) in black men and women. Active smoking was more common among black men and women. Our definition of “normal” subset excluded participants with abnormalities in these characteristics.
Table I.
Clinical, Demographic and Echocardiographic Characteristics According to Gender and Race
| Variable | N | White Men (533) |
Black Men (496) |
White Women (527) |
Black Womeny (532) |
P-Value |
|---|---|---|---|---|---|---|
| Age (years) | 2088 | 31 ± 3 | 29 ± 4 | 31 ± 3 | 29 ± 4 | <0.0001 |
| Height (m) | 2082 | 1.78 ± 0.07 | 1.77 ± 0.07 | 1.65 ± 0.06 | 1.64 ± 0.07 | <0.0001 |
| Weight (lbs) | 2082 | 173 ± 27 | 177 ± 33 | 140 ± 24 | 154 ± 36 | <0.0001 |
| Body mass index (kg/m2) | 2082 | 24.7 ± 3.3 | 25.6 ± 4.1 | 23.2 ± 3.8 | 26.1 ± 6.0 | <0.0001 |
| Body surface area (m2) | 2085 | 1.93 ± 0.17 | 1.94 ± 0.19 | 1.68 ± 0.15 | 1.73 ± 0.19 | <0.0001 |
| History of asthma | 2088 | 65 (12.2%) | 75 (15.1%) | 56 (10.6%) | 85 (16.0%) | 0.04 |
| History of COPD | 2088 | 20 (3.8%) | 20 (4.0%) | 30 (5.7%) | 16 (3.0%) | 0.16 |
| On antihypertensive | 2088 | 7 (1.3%) | 4 (0.8%) | 0 | 12 (2.3%) | 0.005 |
| Average systolic BP (mmHg) | 2087 | 109 ± 10 | 113 ± 11 | 101 ± 8 | 106 ± 11 | <0.0001 |
| Average diastolic BP (mmHg) | 2087 | 70 ± 9 | 72 ± 10 | 64 ± 8 | 69 ± 10 | <0.0001 |
| Total cholesterol (mg/dL) | 2040 | 179 ± 34 | 177 ± 36 | 175 ± 32 | 175 ± 30 | 0.12 |
| Forced expiratory vol. 1 second (FEV1) (L) | 2064 | 4.39 ± 0.63 | 3.74 ± 0.61 | 3.30 ± 0.45 | 2.85 ± 0.47 | <0.0001 |
| Forced vital capacity (FVC) (L) | 2064 | 5.53 ± 0.75 | 4.62 ± 0.72 | 4.01 ± 0.56 | 3.41 ± 0.55 | <0.0001 |
| % of predicted FEV1 | 2063 | 98 ± 12 | 98 ± 14 | 101 ± 11 | 102 ± 14 | <0.0001 |
| % of predicted FVC | 2063 | 101 ± 10 | 102 ± 13 | 103 ± 11 | 104 ± 14 | <0.0001 |
| Exercise time (minutes) | 2070 | 12.5 ± 2.3 | 11.3 ± 2.4 | 9.6 ± 2.2 | 7.4 ± 2.1 | <0.0001 |
| Echocardiographic Doppler mitral E/A ratio | 2078 | 1.86 ± 0.50 | 1.88 ± 0.55 | 1.89 ± 0.56 | 1.84 ± 0.51 | 0.37 |
| M-Mode LV mass height index g/m2.7) | 2045 | 35.6 ± 7.7 | 38.3 ± 8.7 | 31.7 ± 7.9 | 34.9 ± 9.3 | <0.0001 |
| M-MODE: LV end-diastolic dimension (cm) | 2051 | 5.2 ± 0.423 | 5.16 ± 0.44 | 4.75 ± 0.388 | 4.73 ± 0.429 | <0.0001 |
| LV ejection fraction (%) | 1666 | 63 ± 6 | 62 ± 7 | 64 ± 5 | 64 ± 7 | 0.0002 |
| 2D: LV end-diastolic volume (mL) | 1676 | 137 ± 29 | 136 ± 30 | 108 ± 23 | 107 ± 25 | <0.0001 |
| LV end-diastolic volume index (mL/m2) | 1673 | 71.0 ± 13.4 | 70.4 ± 14.3 | 64.3 ± 12.0 | 62.0 ± 12.7 | <0.0001 |
| Left atrial area (cm2) | 2058 | 15.9 ± 3.3 | 17.0 ± 3.6 | 14.6 ± 3.1 | 15.6 ± 3.4 | <0.0001 |
| Left atrial dimension (cm) | 2080 | 3.64 ± 0.43 | 3.64 ± 0.48 | 3.34 ± 0.40 | 3.40 ± 0.43 | <0.0001 |
| Tricuspid regurgitation present | 2088 | 33 (6.2%) | 43 (8.7%) | 47 (8.9%) | 65 (12.2%) | 0.008 |
| Mitral stenosis present | 2088 | 0 | 0 | 0 | 0 | |
| Smoking | 2081 | <0.0001 | ||||
| Never smoker | 329 (62.0%) | 264 (53.2%) | 298 (56.9%) | 322 (60.8%) | ||
| Former smoker | 87 (31.3%) | 38 (7.7%) | 118 (22.5%) | 35 (6.6%) | ||
| Current smoker | 115 (21.7%) | 194 (39.1%) | 108 (20.6%) | 173 (32.6%) | ||
| Pulmonary outflow Doppler time to peak <70 ms | 2064 | 2 (0.4%) | 2 (0.4%) | 0 | 3 (0.6%) | 0.47 |
Values are mean ± SD or N (%).
Table II shows a comparison between demographic and morphometric characteristics of those in whom RVED area was measured versus unavailable. Compared to those with RVED area measurements, those without RVED area measurements were slightly older, more likely female, have a larger body habitus, higher blood pressure, lower % predicted FVC and a higher proportion with pulmonary artery acceleration time of <120 ms (a marker of elevated mean pulmonary pressure). However, LV mass and function as well as left atrial area were similar. A significantly higher proportion (32%) of those in whom RVED area was not measured had no quality score assessment, and the percentage with “good” quality scores was lower. However, there was no systematic difference between participants to account for missing measurements of RVED area.
Table II.
Comparison of Clinical and Demographic Characteristics in Participants with and without Year 5 RVED Area Measurements
| Demographic and Clinical Characteristics |
RVED Area Measured (N = 2088) |
RVED Area Missing (N = 2155) |
P-Value | ||
|---|---|---|---|---|---|
| Mean (Std Err) | N | Mean (Std Err) | N | ||
| Age (years) | 29.8 (0.08) | 2088 | 30.1 (0.08) | 2155 | 0.004 |
| Female, (%) | 51% | 1059 | 59% | 1276 | <0.0001 |
| Black, n (%) | 49% | 1028 | 47% | 1022 | 0.24 |
| Education (years) | 14.4 (0.05) | 2086 | 14.3 (0.05) | 2150 | 0.06 |
| Body surface area (m2) | 1.82 (0.004) | 2085 | 1.87 (0.005) | 2153 | <0.0001 |
| Body mass index (kg/m2) | 24.9 (0.10) | 2082 | 27.3 (0.15) | 2144 | <0.0001 |
| Systolic blood pressure (mmHg) | 107.0 (0.24) | 2087 | 108.5 (0.26) | 2152 | <0.0001 |
| Diastolic blood pressure (mmHg) | 68.6 (0.21) | 2087 | 69.8 (0.22) | 2152 | 0.0002 |
| Left atrial area (cm2) | 15.8 (0.08) | 2058 | 15.9 (0.17) | 447 | 0.68 |
| LV mass (kg) | 150.1 (0.96) | 2051 | 148.9 (1.02) | 2060 | 0.4 |
| LV ejection fraction (%) | 0.63 (0.002) | 1666 | 0.64 (0.005) | 224 | 0.4 |
| % predicted FEV1 | 99.8 (0.28) | 2063 | 98.4 (0.30) | 2106 | 0.0008 |
| % predicted FVC | 102.4 (0.27) | 2063 | 100.7 (0.27) | 2106 | <0.0001 |
| Cigarettes/day | 3.6 (0.16) | 2077 | 3.9 (0.17) | 2152 | 0.12 |
| Smoking status | 0.29 | ||||
| Never smoker | 58% | 1213 | 56% | 1211 | |
| Former smoker | 13% | 278 | 15% | 319 | |
| Current smoker | 28% | 590 | 29% | 622 | |
| Quality score | <0.0001 | ||||
| Poor | 29% | 611 | 31% | 644 | |
| Fair | 45% | 937 | 25% | 534 | |
| Good | 22% | 452 | 12% | 254 | |
| Excellent | 1% | 14 | 1% | 16 | |
| BSA in top 20th percentile | 336 | 524 | <0.0001 | ||
| Quality score poor/fair | 78% | 261 | 50% | 264 | |
| PAAcct (ms) mean (SD) | 144.1 (0.64) | 2064 | 135.3 (0.65) | 2108 | <0.0001 |
| Severe pulmonary HTN (<70 ms) | 0.3% | 7 | 1.8% | 38 | <0.0001 |
| Mild pulmonary HTN (70–110 ms) | 11.1 | 230 | 16.9 | 356 | |
| Normal (>120 ms) | 88.5 | 1827 | 81.3 | 1714 | |
BSA = Body surface area; HTN = Hypertension; PAAcct = Pulmonary artery acceleration time (milliseconds); RVED = Right ventricular end-diastolic
Figure 1 shows the distribution of RVED area by gender and race. With the exception of white women, the RVED area was normally distributed as shown by the Anderson–Darling test for normality. A comparison of RVED area between black and white males or between black and white female participants showed no significant ethnicity-related differences (P = 06) whereas there were significant gender-related differences (P < 0.0001) in the overall cohort as well as among the subset of “normal” participants. Table III shows normative values of RVED area, indexed to height and body surface area with the lower and upper 95 percent reference limits in the 2088 overall, and the 735 “normal” participants. The normal participants have RVED area indexed to BSA (cm2/m2) of 8.9 ± 2.1 and 8.1 ± 1.9 for men and women, respectively. These values are identical for the overall cohort of 2,088 participants. The RVED area (cm2) and RVED area/BSA index (cm2/m2) seen in 91 male participants with high physical fitness (16.88 ± 4.22, and 8.94 ± 2.15, respectively) and the corresponding number in females (13.40 ± 3.26 and 8.17 ± 1.89, respectively) fall within the upper 95th percent limits of normal for either gender.
Figure 1.
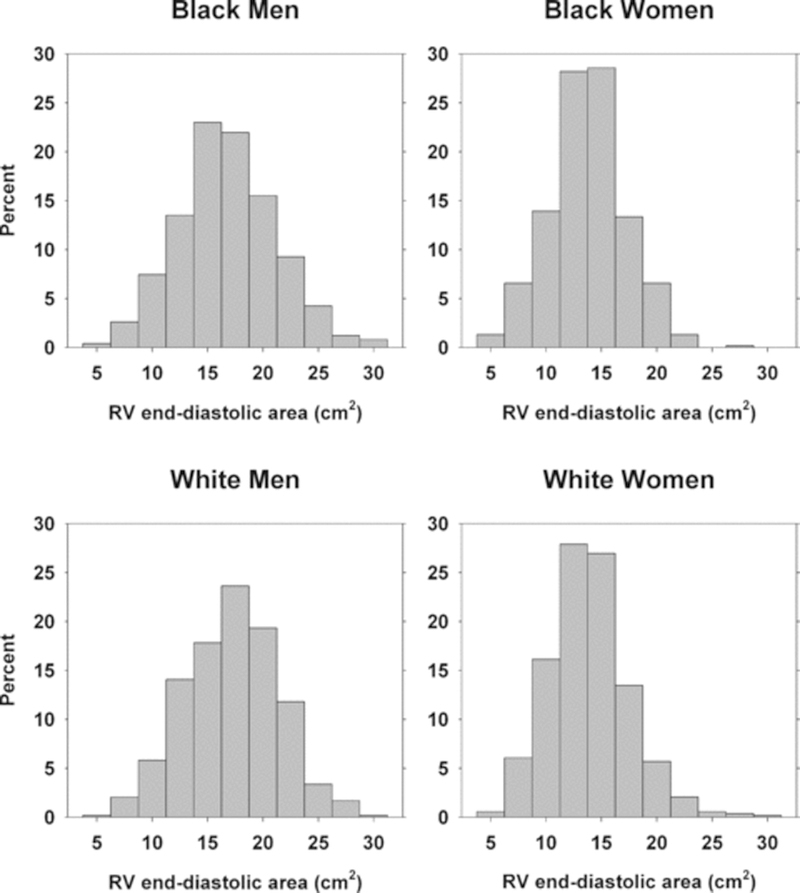
Frequency distribution of RV end-diastolic area according to ethnicity and gender in all participants with available measurement.
Table III.
RV Area, and RVED Area Indexed to BSA and Height (Mean, Standard Deviation, and 95% Reference Ranges) by Race-Gender Group for Participants Classified as Normal
| All Subjects |
Mean | STD | Lower 95% Reference Limit (2.5th Percentile) |
Upper 95% Reference Limit (97.5th Percentile) |
Normal Subset |
Mean | STD | Lower 95% Reference Limit (2.5th Percentile) |
Upper 95% Reference Limit (97.5th Percentile) |
|
|---|---|---|---|---|---|---|---|---|---|---|
| Black men | RVED area (cm2) | 16.8 | 4.4 | 8.4 | 25.4 | Black men | 16.7 | 3.9 | 9.1 | 24.7 |
| (n = 496) | RVED area/BSA index (cm2/m2) | 8.7 | 2.2 | 4.3 | 12.8 | (n = 124) | 8.7 | 1.9 | 4.6 | 12.2 |
| RVED area/height index (cm2/m) | 9.5 | 2.4 | 5 | 14.2 | 9.4 | 2.1 | 5.1 | 13.4 | ||
| Black | RVED area (cm2) | 13.7 | 3.5 | 7 | 21 | Black | 13.5 | 3.4 | 6.2 | 20.7 |
| women | women | |||||||||
| (n = 532) | RVED area/BSA index (cm2/m2) | 7.9 | 1.9 | 4 | 11.6 | (n = 142) | 8.2 | 2 | 3.7 | 11.8 |
| RVED area/height index (cm2/m) | 8.4 | 2.1 | 4.2 | 12.5 | 8.3 | 2 | 3.9 | 12.1 | ||
| White men | RVED area (cm2) | 17.2 | 4.2 | 8.8 | 25 | White men | 17.1 | 4.2 | 8.3 | 24.7 |
| (n = 533) | RVED area/BSA index (cm2/m2) | 8.9 | 2.1 | 4.4 | 12.6 | (n = 247) | 8.9 | 2.1 | 4.2 | 12.7 |
| RVED area/height index (cm2/m) | 9.7 | 2.3 | 5 | 14 | 9.6 | 2.3 | 4.6 | 13.9 | ||
| White | RVED area (cm2) | 13.9 | 3.6 | 7.7 | 21.7 | White | 13.3 | 3.2 | 7.7 | 20.9 |
| women | women | |||||||||
| (n = 527) | RVED area/BSA index (cm2/m2) | 8.3 | 2 | 4.7 | 12.6 | (n = 222) | 8 | 1.8 | 4.7 | 11.7 |
| RVED area/height index (cm2/m) | 8.4 | 2.2 | 4.6 | 13.3 | 8.1 | 1.9 | 4.6 | 12.6 | ||
| All men | RVED area (cm2) | 17 | 4.3 | 8.6 | 25.4 | 17 | 4.1 | 8.4 | 24.7 | |
| RVED area/BSA index (cm2/m2) | 8.8 | 2.1 | 4.4 | 12.7 | 8.9 | 2.1 | 4.3 | 12.6 | ||
| RVED area/height index (cm2/m) | 9.6 | 2.4 | 5 | 14.1 | 9.5 | 2.3 | 4.7 | 13.8 | ||
| All women | RVED area (cm2) | 13.8 | 3.5 | 7.2 | 21.2 | 13.4 | 3.3 | 7.1 | 20.7 | |
| RVED area/BSA index (cm2/m2) | 8.1 | 1.9 | 4.2 | 11.9 | 8.1 | 1.9 | 4.4 | 11.7 | ||
| RVED area / height index (cm2/m) | 8.4 | 2.1 | 4.4 | 12.8 | 8.1 | 2 | 4.4 | 12.5 | ||
Bivariate Correlations:
In the total cohort, RVED area and left atrial area were moderately correlated even after adjustment for height and weight among all ethnic groups and gender. The adjusted Pearson partial correlations (r) were 0.49, 0.36, 0.42, and 0.41, respectively, among black men, black women, white men, white women. Similarly, the adjusted correlation between RVED areas and LV end-diastolic volumes were 0.47, 0.46, 0.49, and 0.52, respectively. There was a significant but weak unadjusted correlation with forced vital capacity (FVC) in each stratum. These correlations became insignificant, except in black men, after adjusting for height and weight. The % predicted FEV1 showed a significant correlation with RVED area only in black men. Multiple regression analysis including single and combinations of variables showed that the best simple model explaining most of the variability in RVED area includes LV end-diastolic volume, LA area, LV mass and body surface area. The respective overall R2 for the models were 33.8, 27.8, 30.7, and 39.7 for black men, black women, white men and white women, respectively. The addition of FVC to this model only increased the % variability explained in black men to 35.3%.
Discussion:
This study represents to our knowledge the largest data set on demographic, anthropometric, clinical and physiologic correlates of RVED area in a biracial cohort of community-dwelling young adults. We also provide gender-based normative values on a subset of this cohort after excluding subjects with any clinical markers of cardiac or pulmonary disorders or risk factors (clinical normal reference group). Our clinically normal reference group is unique in having more participants (n = 735) than other published series that enrollled far fewer participants who were not as comprehensively characterized.5 Hence our study is adequately powered for defining the normative values of this specific measurement. Morphologic changes to the right ventricle occurs during the early stages of diseases which are eventually associated with pulmonary hypertension, chronic pulmonary disease or RV failure.1, 2 Although RVED area represents an indirect measure of RV volume, its measurement is simple, compared to alternative measures of RV morphology and function. This specific marker of RV size has been used clinically to identify the likelihood of LV reverse remodeling in patients treated with cardiac resynchronization therapy,17 prognosticate mortality in patients with dilated cardiomyopathy,11 characterize severity of RV dysfunction correlated with RV systolic pressure2 and RV dyssynchrony in patients with pulmonary hypertension.18, 19 Increasing numbers of publications have demonstrated the importance of markers of RV enlargement in prognosticating both right and left ventricular, as well as pulmonary disorders20–23 making it imperative that a practical and reasonably reliable determination of normative values of RV size be developed.
In the current study, RVED area and measures of LV size, and left atrial size, were correlated in the absence of clinically obvious pathologies. The gender-specific variability seen in the correlations of RVED area is an important reminder of the need to use gender-appropriate reference values. The correlation between percent predicted FEV1 especially in black men may relate to a higher prevalence of smoking and asthma.
Comparison with Previous Studies:
It is known that RV size does not change significantly with normal aging.24, 25 Our normative data represent values in healthy free-living adults, and can be used for determining the upper limits of RV size. The important relationship of gender to RV volume shown in our data is consistent with reports from newer studies of RV volume.5, 26
Compared to patients without right or left ventricular dysfunction, Lopez-Candales et al. reported that the normal subjects had a mean (±SD) RVED area of 18 ± 5 cm2.19 When pulmonary hypertension was defined as PA systolic pressure >40 mmHg, receiver operator characteristics showed that abnormal RVED area could be defined by RVED area >23 cm2with an area under-the-curve of 0.81. In another study of patients with dilated cardiomyopathy,11 the mean RVED area in those considered not to have enlarged RV was 18 ± 4 cm2, which is within the 95% reference interval for normal men in our study (Table III). Scuteri et al.17 found that markers of RV morphology including RVED area were the only baseline echo measures that predicted the likelihood of 6‐month responsiveness to cardiac resynchronization. They found an RVED area (cm2) of 16 ± 3 in responders compared to 23 ± 6 in nonresponders.17 A simple ratio of RV/LV end-diastolic areas was found to have prognostic value in patients with congestive heart failure and with acute pulmonary embolism.6, 11, 27
Significance:
RV end-diastolic area echo measurements were shown to correlate highly (r = 0.88) with MRI measurements of RV volume,8 and are better than linear dimensions for separating patients with RV volume overload from normal subjects.28 Although volumetric assessment of the RV by 3D echo is likely to be more accurate,4 2D echo is currently more accessible to practitioners for clinical decision-making. The recent report that 3D volumetric measurements may have a greater variability than 2D measures of RV size calls into question the presumed superiority of volumetric methods in clinical decision making.26 Normative values of RVED area in a large, healthy, young cohort could provide a benchmark for evaluating interval changes in RV size and possibly detecting subclinical cardiac or pulmonary disease.
Limitations:
At the time of the CARDIA echo study in 1990, assessment of RV morphology using multiple echocardiographic measurements was uncommon, and the interest in measuring RV size was its relationship with pulmonary disease,2 hence RVED area measurement was not a primary focus of CARDIA, and assessment of markers of RV systolic function such as RV fractional area change was not part of the imaging protocol. Furthermore, this study is limited in presenting only one measure of RV size, which is an indirect measure of RV volume. RVED area measurement was unavailable in half of the participants especially those who are obese, with impaired lung capacity and those with higher likelihood of pulmonary hypertension. Since this study aims to provide normative values, the exclusion of such patients does not reduce the utility of our results. The size of this dataset represents an order of magnitude at least 10 times the data currently available in the literature for any single study. Unfortunately, the intra‐ and interobserver variability of these measurements was not assessed. Mean intraobserver and interobserver variabilities (expressed as % difference between measurements) for RVED area in a similar study were 2.9%± 0.8% and 3.6%± 1.9%, respectively.8 A recent study compared the intraobserver variability (expressed as coefficient of variability) between 2D measurement of RVED area and 3D RV volume measurement and reported a better coefficient of variability for an unblinded review for RVED area compared to 3D RV diastolic volume.26 Our definition of “normal” participants based on only a small set of clinically relevant parameters may only be as accurate as similar assumptions of normality made in routine clinical practice. Also, we defined pulmonary hypertension using pulmonary acceleration time rather than the more accurate definition using tricuspid regurgitation (TR) velocity. The CARDIA protocol included pulmonary acceleration time rather than TR evaluation as the primary method for detecting pulmonary hypertension based on the prevailing understanding at the time. Given that our data does not include any echocardiographic measures of RV function, the normative values presented is solely a measure of RV size.
Conclusion:
In this study of biracial cohort of young asymptomatic adults, RVED area was greater for men than for women even after indexing for body surface area or height, whereas it was similar between blacks and whites of the same gender.
Acknowledgements:
Kofo O Ogunyankin, M.D., Originated idea of manuscript, coordinated activities of co-authors, interpreted data, compiled analyses, authored manuscript. Kiang Liu, Ph.D., Designed the statistical analysis plan, interpreted data, revised manuscript. Site Principal investigator with full access to all data and fully vouches for the integrity of the data. Donald M. Lloyd-Jones, M.D., Enhanced analysis plan, interpreted data, co-authored manuscript. Laura A Colangelo, M.S., Performed all statistical analysis, co-authored manuscript. Julius M Gardin, M.D., Provided critical insight into study design, interpreted data, reviewed and edited manuscript.
This research was funded by contracts N01-HC-48047, N01-HC-48048, N01-HC-48049, N01-HC-48050 and N01-HC-95095 from the National Heart, Lung, and Blood Institute, National Institutes of Health, Bethesda, MD. CARDIA Clinicaltrials.gov identifier is
Footnotes
Disclosures: None.
References
- 1.Voelkel NF, Quaife RA, Leinwand LA, et al. : Right ventricular function and failure—Report of a National Heart, lung, and Blood Institute working group on cellular and molecular mechanisms of right heart failure. Circulation 2006;114(17):1883–1891. [DOI] [PubMed] [Google Scholar]
- 2.Danchin N, Cornette A, Henriquez A, et al. : Two-dimensional echocardiographic assessment of the right ventricle in patients with chronic obstructive lung disease. Chest 1987;92(2):229–233. [DOI] [PubMed] [Google Scholar]
- 3.Mor-Avi V, Sugeng L, Lindner JR: Imaging the forgotten chamber: Is the Devil in the boundary? J Am Soc Echocardiogr 2010;23(2):141–143. [DOI] [PubMed] [Google Scholar]
- 4.Jiang L, Levine RA, Weyman AE: Echocardiographic assessment of right ventricular volume and function. Echocardiography 1997;14(2):189–205. [DOI] [PubMed] [Google Scholar]
- 5.Tamborini G, Marsan NA, Gripari P, et al. : Reference values for right ventricular volumes and ejection fraction with real-time three-dimensional echocardiography: Evaluation in a large series of normal subjects. J Am Soc Echocardiogr 2010;23(2):109–115. [DOI] [PubMed] [Google Scholar]
- 6.Fremont B, Pacouret G, Jacobi D, et al. : Prognostic value of echocardiographic right/left ventricular enddiastolic diameter ratio in patients with acute pulmonary embolism—Results from a monocenter registry of 1,416 patients. Chest 2008;133(2):358–362. [DOI] [PubMed] [Google Scholar]
- 7.Hui W, Abd El Rahman M, Dsebissowa F, et al. : Comparison of modified short axis view and apical four chamber view in evaluating right ventricular function after repair of tetralogy of Fallot. Int J Cardiol 2005;105(3):256–261. [DOI] [PubMed] [Google Scholar]
- 8.Schenk P, Globits S, Koller J, et al. : Accuracy of echocardiographic right ventricular parameters in patients with different end-stage lung diseases prior to lung transplantation. J Heart Lung Transplant 2000;19(2):145–154. [DOI] [PubMed] [Google Scholar]
- 9.Oe M, Gorcsani JI, Mandarino WA, et al. : Automated echocardiographic measures of right ventricular area as an index of volume and end-systolic pressure-area relations to assess right ventricular function. Circulation 1995;92(4):1026–1033. [DOI] [PubMed] [Google Scholar]
- 10.Lewis JF, Webber JD, Sutton LL, et al. : Discordance in degree of right and left-ventricular dilation in patients with dilated cardiomyopathy—Recognition and clinical implications. J Am Coll Cardiol 1993;21(3):649–654. [DOI] [PubMed] [Google Scholar]
- 11.Sun JP, James KB, Sheng Yang X, et al. : Comparison of mortality rates and progression of left ventricular dysfunction in patients with idiopathic dilated cardiomyopathy and dilated versus nondilated right ventricular cavities. Am J Cardiol 1997;80(12):1583–1587. [DOI] [PubMed] [Google Scholar]
- 12.Lang RM, Bierig M, Devereux RB, et al. : Recommendations for chamber quantification: A report from the American Society of Echocardiography’s guidelines and standards committee and the chamber quantification writing group, developed in conjunction with the European Association of Echocardiography, a branch of the European Society of Cardiology. J Am Soc Echocardiogr 2005;18(12):1440–1463. [DOI] [PubMed] [Google Scholar]
- 13.Foale R, Nihoyannopoulos P, Mckenna W, et al. : Echocardiographic measurement of the normal adult right ventricle. Br Heart J 1986;56(1):33–44. [DOI] [PMC free article] [PubMed] [Google Scholar]
- 14.Kitabatake A, Inoue M, Asao M, et al. : Non-invasive evaluation of pulmonary-hypertension by a pulsed doppler technique. Circulation 1983;68(2):302–309. [DOI] [PubMed] [Google Scholar]
- 15.Gardin JM, Wong ND, Bommer W, et al. : Echocardiographic design of a multicenter investigation of free-living elderly subjects: The Cardiovascular Health Study. J Am Soc Echocardiogr 1992;5(1):63–72. [DOI] [PubMed] [Google Scholar]
- 16.Desimone G, Daniels SR, Devereux RB, et al. : Left-ventricular mass and body size in normotensive children and adults—Assessment of allometric relations and impact of overweight. J Am Coll Cardiol 1992;20(5):1251–1260. [DOI] [PubMed] [Google Scholar]
- 17.Scuteri L, Rordorf R, Marsan NA, et al. : Relevance of echocardiographic evaluation of right ventricular function in patients undergoing cardiac resynchronization therapy. Pacing Clin Electrophysiol 2009;32(8):1040–1049. [DOI] [PubMed] [Google Scholar]
- 18.Lopez-Candales A, Dohi K, Rajagopalan N, et al. : Right ventricular dyssynchrony in patients with pulmonary hypertension is associated with disease severity and functional class. Cardiovas Ultrasound 2005;3(1):23. [DOI] [PMC free article] [PubMed] [Google Scholar]
- 19.Lopez-Candales A, Dohi K, Rajagopalan N, et al. : Defining normal variables of right ventricular size and function in pulmonary hypertension: An echocardiographic study. Postgrad Med J 2008;84(987):40–45. [DOI] [PubMed] [Google Scholar]
- 20.Hombach V, Merkle N, Torzewski J, et al. : Electrocardiographic and cardiac magnetic resonance imaging parameters as predictors of a worse outcome in patients with idiopathic dilated cardiomyopathy. Eur Heart J 2009;30(16):2011–2018. [DOI] [PMC free article] [PubMed] [Google Scholar]
- 21.Burgess MI, Mogulkoc N, Bright-Thomas RJ, et al. : Comparison of echocardiographic markers of right ventricular function in determining prognosis in chronic pulmonary disease. J Am Soc Echocardiogr 2002;15(6):633–639. [DOI] [PubMed] [Google Scholar]
- 22.Chrustowicz A, Simonis G, Matschke K, et al. : Right ventricular dilatation predicts survival after mitral valve repair in patients with impaired left ventricular systolic function. Eur J Echocardiogr 2009;10(2):309–313. [DOI] [PubMed] [Google Scholar]
- 23.Quiroz R, Kucher N, Schoepf UJ, et al. : Right ventricular enlargement on chest computed tomography: Prognostic role in acute pulmonary embolism. Circulation 2004;109(20):2401–2404. [DOI] [PubMed] [Google Scholar]
- 24.Innelli P, Esposito R, Olibet M, et al. : The impact of ageing on right ventricular longitudinal function in healthy subjects: A pulsed tissue Doppler study. Eur J Echocardiogr 2008;10(4):491–498. [DOI] [PubMed] [Google Scholar]
- 25.Chiha J, Boyd A, Thomas L: Does normal ageing alter right ventricular size and function? Heart Lung Circ 2008;17(Suppl 3):S41. [DOI] [PubMed] [Google Scholar]
- 26.Aune E, Baekkevar M, Rodevand O, et al. : The limited usefulness of real-time 3-dimensional echocardiography in obtaining normal reference ranges for right ventricular volumes. Cardiovasc. Ultrasound 2009;7:35. [DOI] [PMC free article] [PubMed] [Google Scholar]
- 27.Lu MT, Cai TX, Ersoy H, et al. : Interval increase in right-left ventricular diameter ratios at CT as a predictor of 30-day mortality after acute pulmonary embolism: Initial experience. Radiology 2008;246(1):281–287. [DOI] [PubMed] [Google Scholar]
- 28.Bommer W, Weinert L, Neumann A, et al. : Determination of right atrial and right ventricular size by two-dimensional echocardiography. Circulation 1979;60 (1):91–100. [DOI] [PubMed] [Google Scholar]