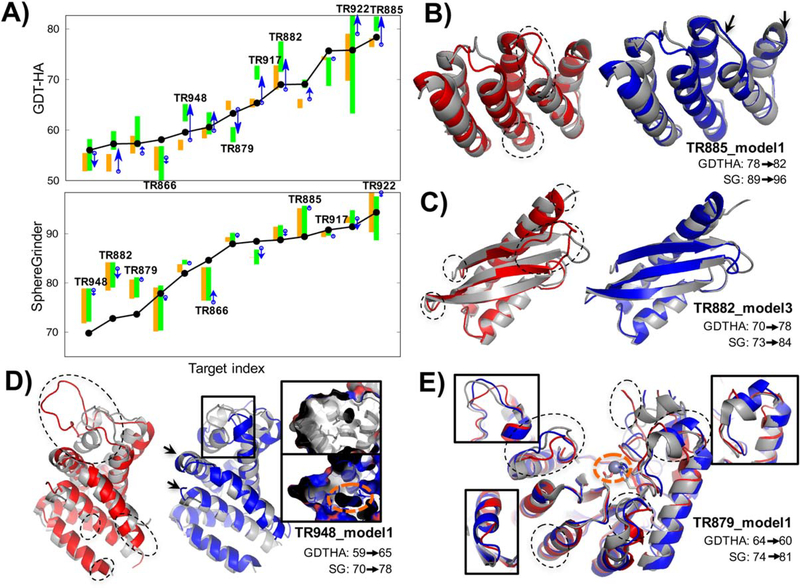
FIGURE 4.
Automated high-resolution refinement combining local rebuilding by Rosetta and MD refinement. A, Decomposition of contribution to refinement by Rosetta and MD in A, GDT-HA (top) and SphereGrinder (bottom). Thirteen targets with native structures available are shown here. For each target, starting model quality is shown in black dots, range of five models by Rosetta modeling and succeeding MD refinement in orange and green bars, respectively, and change in quality of model1 from Rosetta stage to MD refinement by blue arrow. B-E, Structures for the targets with successful refinement or targets showing lessons for future direction. Native, starting model, and refined model structures are shown in gray, red, blue cartoons, respectively. Regions automatically detected and reconstructed are shown in dotted circles. Improvements in secondary structure orientations are highlighted by black arrows. B-C, High-end refinement targets, TR885 and TR882, were successful with our protocol. D, TR948, reconstruction on long region (large circle on top, residue 53–78) put helix at roughly correct position but had poorer hydrophobic packing in our model (below) compared to the native structure (top); void shown as orange circle on the inset panel. E, TR879 was the only target significantly worsen by MD refinement; decrease in GDT-HA solely comes from MD refinement stage, presumably due to ignoring metal binding (black arrow). Reconstructed at five regions, and three of these reproduced correct loop conformations (inset) which led to improvement to SG

