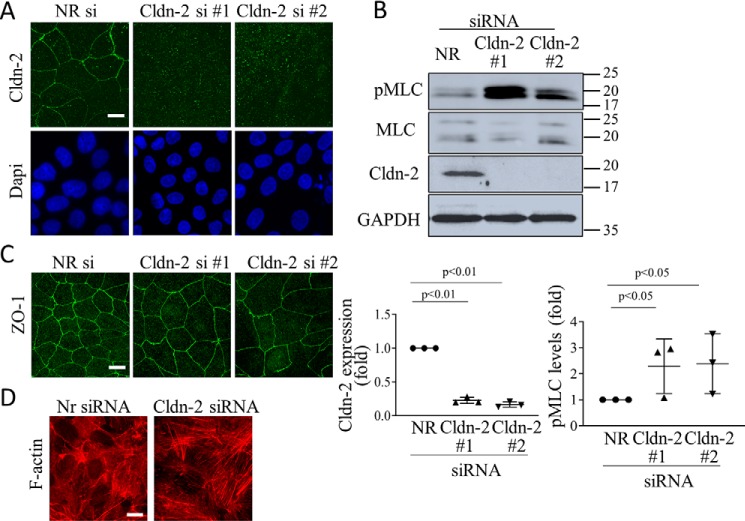
Figure 2.
Claudin-2 silencing does not prevent TJ formation but elevates pMLC levels. LLC-PK1 cells were transfected with NR or Cldn-2–specific siRNA #1 or #2 as indicated, and 2 days later either fixed with ice-cold methanol (A) or paraformaldehyde (C and D), or lysed (B). In A, C, and D, immunofluorescent staining was performed using antibodies against Cldn-2 (A) or ZO-1 (C) or phalloidin rhodamine to label F-actin (D). In A, nuclei were counterstained with DAPI. Z-stacks were obtained using confocal microscopy, and maximal intensity projection pictures were generated using the Metamorph software. In D, Z stacks were obtained from the bottom of the cells to visualize stress fibers. The bar represents 10 μm. B, cells were lysed, and the indicated proteins were detected by Western blotting. Note that two MLC isoforms are visualized by the antibodies. Densitometric analysis shows normalized Cldn-2 and pMLC levels expressed as fold from control (means ± S.D., n = 3).

