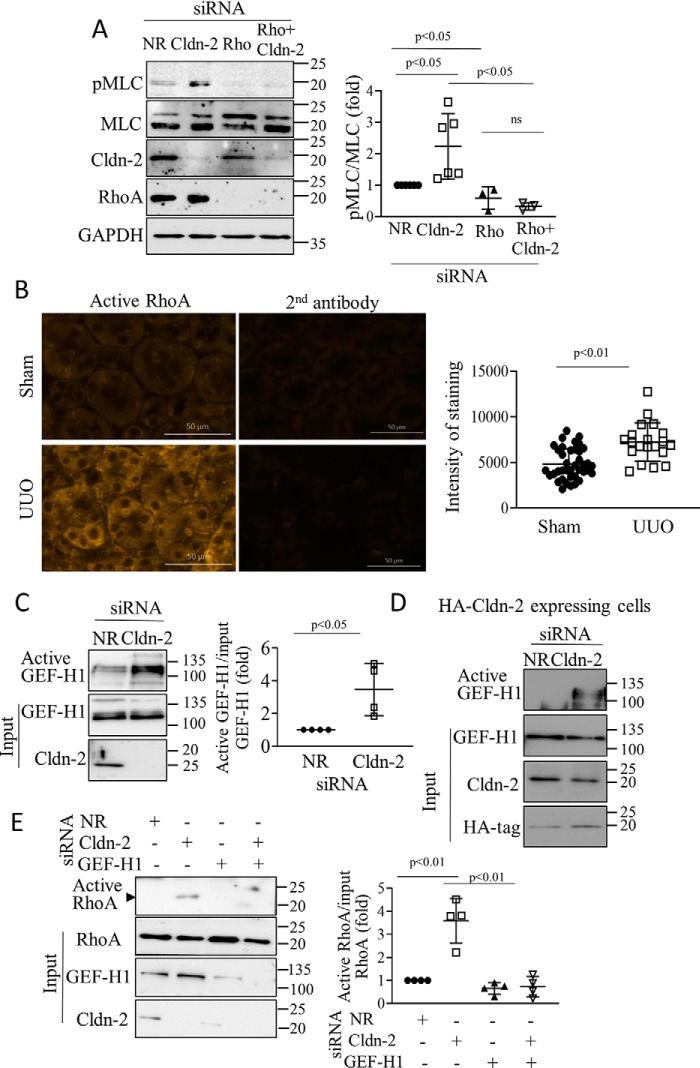
Figure 4.
A, Cldn-2 silencing activates pMLC through RhoA. LLC-PK1 cells were transfected with NR or claudin-2–specific siRNA with or without RhoA-specific siRNA, and 48 h later the cells were lysed, and phospho-MLC was detected and quantified by Western blotting as in Fig. 2 (means ± S.D., n = 3–6). B, active RhoA is elevated in UUO. The mice were sham-operated or underwent UUO (7 days), as in Fig. 1. Active RhoA was detected in renal tissue sections by immunofluorescent staining with a RhoA-GTP–specific antibody as in Fig. 3. The right images show labeling with the secondary antibody alone. Bar, 50 μm. Intensity of the labeling was quantified using the Zen software in regions of 100-μm diameter (>30 regions/animals in three animals in each group). Average labeling in samples exposed to the secondary antibody only was subtracted from each intensity value (means ± S.D.) C–E, Claudin-2 silencing activates RhoA through GEF-H1. C and D, WT or HA–CLDN-2 expressing LLC-PK1 cells were transfected with NR or Cldn-2–specific siRNA, and 48 h later they were lysed, and active GEFs were precipitated using GST–RHOAG17A. Captured (active) and input (total) GEF-H1 was detected by Western blotting. The input cell lysates were redeveloped with Cldn-2 antibody to verify silencing. Active GEF-H1 values were normalized to the input GEF-H1 (means ± S.D., n = 4). E, WT LLC-PK1 cells were transfected with NR or Cldn-2–specific siRNAs with or without GEF-H1 siRNA, and active RhoA was precipitated and quantified as in Fig. 3 (means ± S.D., n = 4).

