Figure 1.
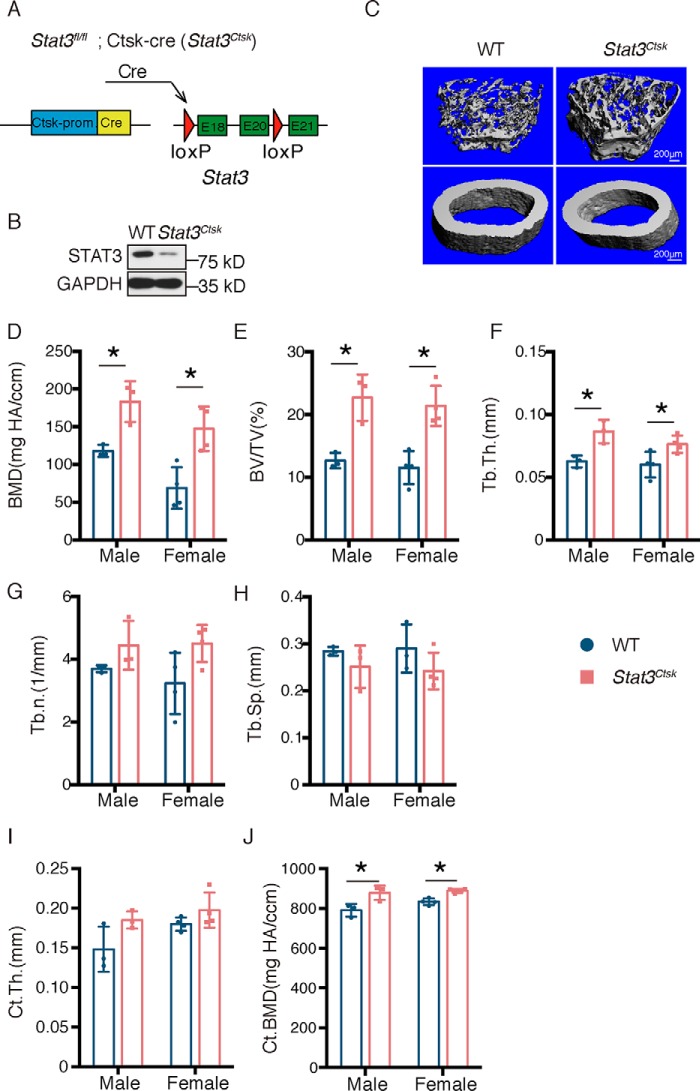
Deletion of Stat3 in osteoclasts led to an increase of bone mass. A, illustration of Stat3 deletion in Ctsk-expressing osteoclasts. B, Western blotting of STAT3 in BMMs from WT and Stat3Ctsk mice cultured with M-CSF and RANKL for 7 days. GAPDH, glyceraldehyde-3-phosphate dehydrogenase. C, three-dimensional micro-CT reconstruction images of femora from 20-week-old WT and Stat3Ctsk mice. The top panel shows trabecular bone, and the bottom panel represents cortical bone. A total of 1-mm-wide trabecular bone close to the distal growth plate and a 1-mm-wide section of cortical bone from the middle of the femur were three-dimensionally reconstructed. Representative examples are shown. D–J, quantitative microarchitectural parameters of micro-CT: BMD, BV/TV, Tb.Th., Tb.N., Tb.Sp., Ct.Th., and Ct.BMD. Three pairs of male Stat3Ctsk and their Stat3fl/fl littermates and four pairs of female Stat3Ctsk and their Stat3fl/fl littermates were included in the measurement. Error bars represent mean ± S.D.; *, p < 0.05.

