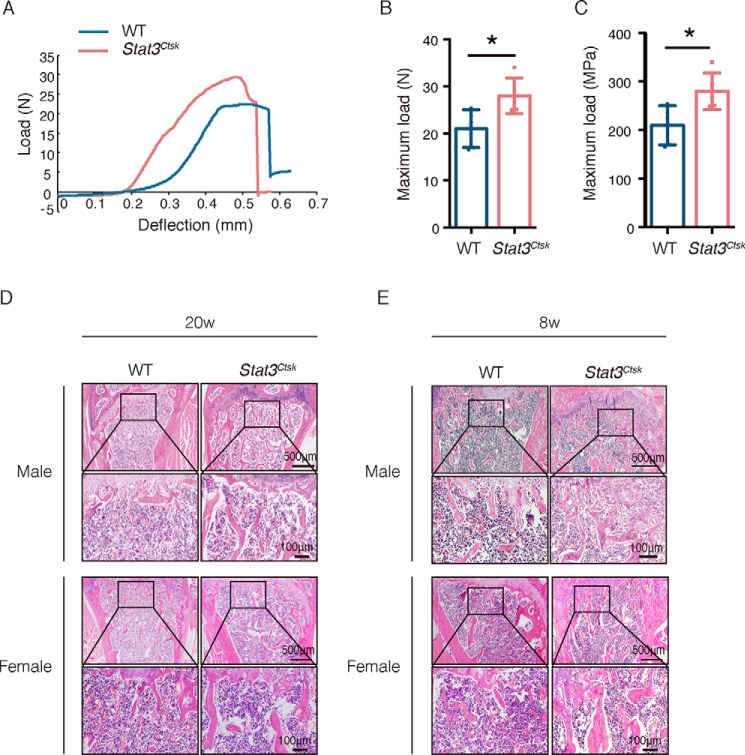
Figure 2.
Deletion of Stat3 in osteoclasts led to an increase of bone stiffness. A, representative load-deflection diagram from a three-point bending test performed on femora of 20-week-old Stat3Ctsk mice and their Stat3fl/fl littermates. B and C, maximum load measured during the test. Error bars are represented as mean ± S.D.; *, p < 0.05. Five pairs of Stat3Ctsk mice and their Stat3fl/fl littermates were tested. D and E, H&E staining of the femora of male and female 20-week-old (D) and 8-week-old (E) WT and Stat3Ctsk mice. The bottom panel shows high-power images of the primary spongiosa. Five pairs of male and female Stat3Ctsk mice and their Stat3fl/fl littermates were included, and representative examples are shown.

