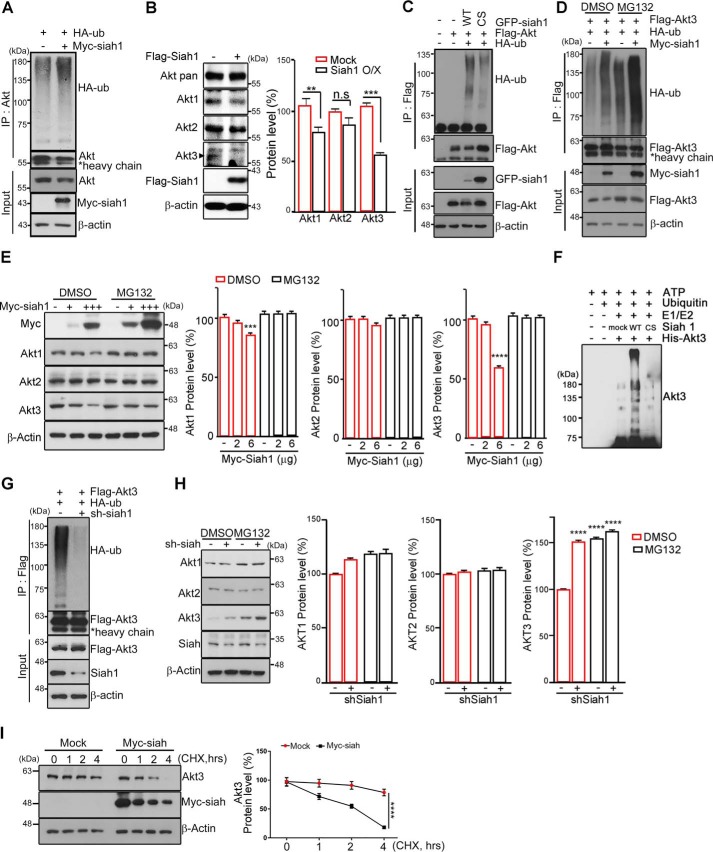
Figure 2.
Siah1 is a novel E3 ligase for Akt. A, PC12 cells were transfected with HA-ubiquitin (HA-ub) and Myc-Siah1. The cell lysates were immunoprecipitated (IP) with anti-Akt antibody. The ubiquitinated Akt was detected by immunoblotting using an anti-HA antibody. The total amount of protein was checked with anti-actin antibody. B, PC12 cells were transfected with FLAG control and FLAG-Siah1. The endogenous levels of the Akt isoform proteins were detected with specific antibodies as indicated. The total amount of protein was checked with anti-actin antibody. The bar graphs show quantified protein levels of Akt1, Akt2, and Akt3 (right panel). Data are shown as mean ± S.E. of three independent experiments; n.s., not significant; **, p = 0.0064; ***, p = 0.0005. O/X, overexpression. C, PC12 cells were transfected with the indicated constructs. The cell lysates were subjected to immunoprecipitation with the anti-FLAG antibody. Ubiquitinated Akt was detected using anti-HA antibody. C/S, C41S/C44S. D, PC12 cells were transfected with the indicated constructs. After transfection for 24 h, cells were treated with 10 μm MG132 for 8 h. The cell lysates were immunoprecipitated with anti-FLAG antibody. The ubiquitination was checked with anti-HA antibody. E, PC12 cells were transfected with the indicated amounts of Myc-Siah1 and treated with 10 μm MG132 for 8 h. The levels of Akt isoforms were detected by immunoblot. The bar graph shows quantification of Akt isoform protein levels (right panel). Data are shown as mean ± S.E. of three independent experiments. ***, p < 0.0005; ****, p < 0.0001. F, in vitro ubiquitination of Akt3 by Siah-1 was performed with ubiquitin, E1, E2-UbcH5a, His-Akt3, and GST-Siah1 (WT or C41S/C44S). After addition of ATP, the samples were incubated at 30 °C for 2 h. The reactions were terminated with SDS loading buffer and boiling for 10 min. The Coomassie-stained SDS-PAGE gel is shown in Fig. S1D. G, PC12 cells were cotransfected with shSiah1 and FLAG-Akt. The cell lysates were subjected to an immunoprecipitation assay. The total amount of protein was checked with anti-actin antibody. H, PC12 cells were transfected with shSiah1and treated with 10 μm MG132 for 8 h. The protein levels of Akt isoforms were detected by immunoblot. The bar graphs represent quantification of the protein levels of the Akt isoforms (right panel). ****, p < 0.0001. I, PC12 cells were transfected with Myc and Myc-Siah1 and treated with 10 μm cycloheximide (CHX) for the indicated times (left panel). The bar graphs show quantified protein levels of Akt3 (right panel). Data are shown as mean ± S.E. of three independent experiments; one way analysis of variance; ****, p < 0.0001.

