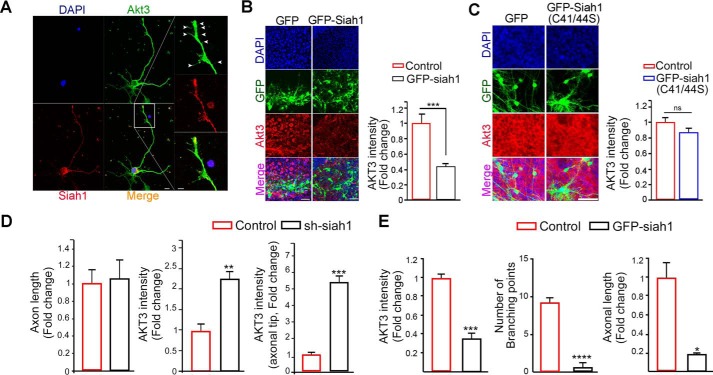
Figure 4.
Siah1-mediated Akt3 degradation controls axonal branches and growth. A, a neuron was immunostained with Siah1 (red) and Akt3 (green) at DIV 3. Scale bar = 10 μm. An enlargement of the boxed area is shown on the right. Scale bar = 5 μm. The images shown here are representative of at least three independent experiments. Arrowheads indicate Akt3 in the branch. B and C, embryo brain slices were infected with ad-GFP, ad-GFP-Siah1(WT), or GFP-Siah1 (C41S/C44S) at DIV 5 and fixed at DIV 10. The embryo brain slices were stained with Akt3 (red). Scale bars = 50 μm. The bar graphs show Akt3 signal intensity. Data are shown as mean ± S.E. of three independent experiments. ***, p = 0.0001; ns, not significant. The images shown here are representative of at least three independent experiments. D, hippocampal neurons were infected with adeno-GFP or adeno-shSiah1 virus at DIV 2 and fixed at DIV 4. The bar graphs show length and Akt3 signal intensity. Data are shown as mean ± S.E. of three independent experiments. **, p = 0.0026; ***, p = 0.0003. E, hippocampal neurons were transfected with GFP or GFP-Siah1 at DIV 2 and fixed at DIV 4. The bar graphs show Akt3 signal intensity, axonal length, and a number of branch points. Data are shown as mean ± S.E. of three independent experiments. ***, p = 0.0006; ****, p < 0.0001.

