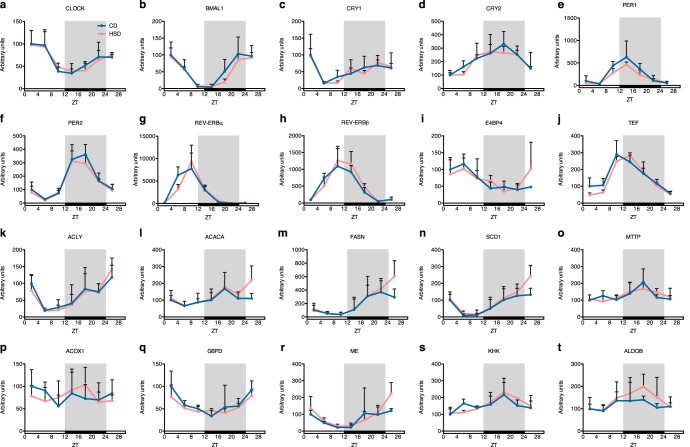
Figure 6.
Transcription rates of lipogenic genes displayed different oscillation patterns compared with those of mRNA levels with HSD treatment. Nascent mRNA levels of important clock genes (a–j), and genes involved in lipid metabolism (k–t) are shown (n = 4/group at each time point). Error bars, S.D.

