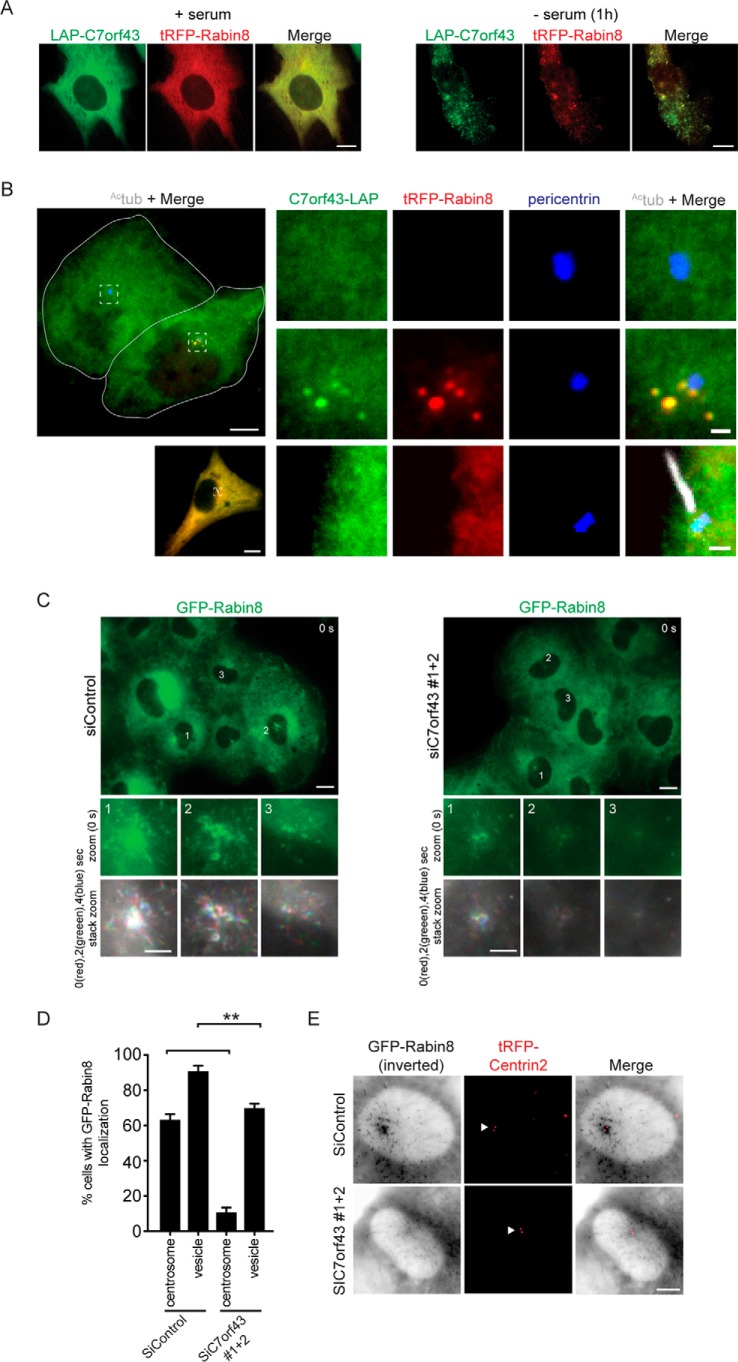
Figure 3.
C7orf43 is required for Rabin8 preciliary trafficking to the centrosome. A, live-cell imaging using spinning-disk confocal microscopy of 24-h transiently co-expressed LAP-C7orf43 and tRFP-Rabin8 in RPE-1 cells grown in the presence of serum or serum-starved for 1 h. Representative images are shown from three independent experiments. Scale bars, 5 μm. B, RPE-1 cells transiently expressing C7orf43-LAP and tRFP-Rabin8 for 24 h and serum-starved the last hour, fixed and stained with antibodies marking the centrosome (pericentrin) and Actub (cilia). Merged refers to green, red, and blue channels. The white dashed boxes in the left panels show the full cell corresponding to magnified panels to the right. The top left image displays a white outline of two cells, one with (top cell for magnified images in the top right panels) and the other without (bottom cell for magnified images in the middle right panels) tRFP-Rabin8 expression. The bottom left image displays a cell with a cilia (magnified images in the bottom right panels) expressing C7orf43-LAP and tRFP-Rabin8. Representative images are shown from three independent experiments. Scale bars, 5 μm (left image) and 0.5 μm (magnified right images). C, representative images from time lapses of RPE-1 GFP-Rabin8 cells treated with either siControl (left panels) or siC7orf43 (right panels), serum-starved for 1–2 h and imaged by live epifluorescence microscopy from three independent experiments. Scale bar, 10 μm. Top insets, zoom of GFP-Rabin8 centrosomal accumulation in cells 1, 2, and 3 at time point 0 s. Bottom insets, to better visualize vesicle movement, zoom images of insets from time points 0, 2, and 4 s were pseudocolored red (0 s), green (2 s), and blue (4 s), respectively, and merged. Scale bars, 5 μm. D, corresponding quantification of GFP-Rabin8 centrosomal and vesicular accumulation from C. Two-tailed, unpaired Student's t test was used. Means ± S.E. (error bars) are shown from three independent experiments with n > 150 cells quantified in total. **, p < 0.01; ***, p < 0.001. E, representative images of live RPE-1 cells stably expressing GFP-Rabin8 and tRFP-CENTRIN2, treated with either siControl or siC7orf43, serum-starved at 72 h post-transfection for 2 h to promote Rabin8 trafficking, and imaged by epifluorescence microscopy from three independent experiments. GFP-Rabin8 signal was inverted to better visualize membrane vesicles. White arrow, tRFP-CENTRIN2 localizing to mother and daughter centrioles. Scale bar, 5 μm.

