Figure 4.
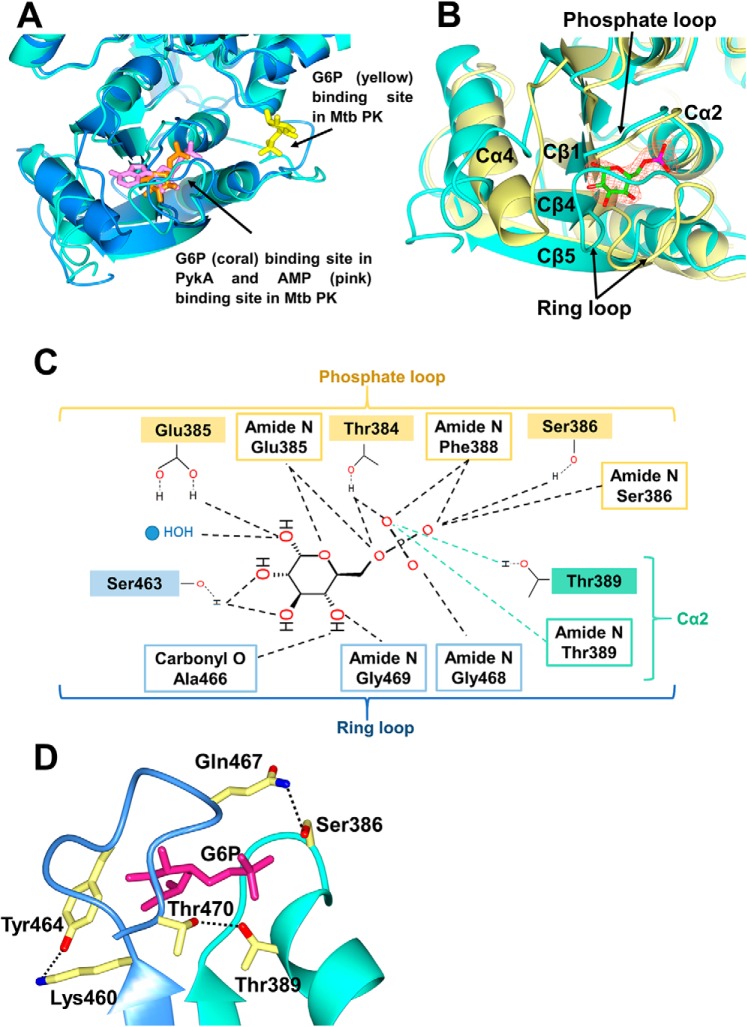
The G6P-binding site in PykA. A, superposition of the allosteric site in PykA from P. aeruginosa (light green) and PK from M. tuberculosis (PDB 5WSB, blue). The G6P in PykA is shown in coral, whereas the AMP and G6P in Mtb PK are shown in pink and yellow, respectively. B, superposition of the allosteric pocket in G6P-bound PykA (light green) and unbound PykF from E. coli (yellow). The G6P is shown surrounded by an electron density map (orange mesh, Fo− Fc map contoured at 3σ). C, schematic of the interactions involved in binding G6P to PykA. D, interaction of the phosphate loop (light green) and ring loop (blue) in the G6P-binding site of PykA. The G6P is shown as magenta sticks.

