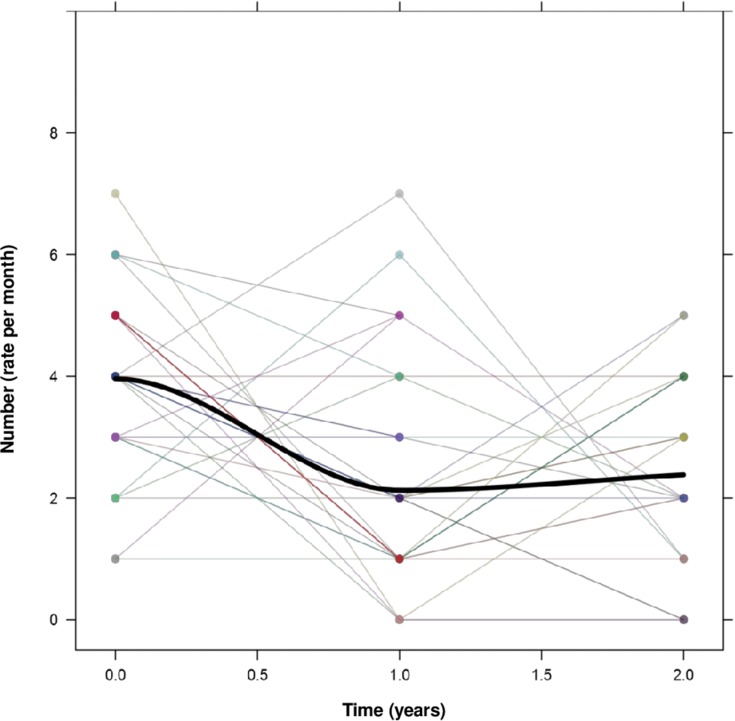
Figure 2.
Exacerbations (rate per month). Number of ECOPD per patient before (time 0) and after nebulized colistin, at first and second year. Each patient is represented by a thin unbroken coloured line. The thick black line represents the estimated average decrease in the whole group based upon the applied mixed model for repeated measures with fixed effects of follow-up time.

