Figure 4.
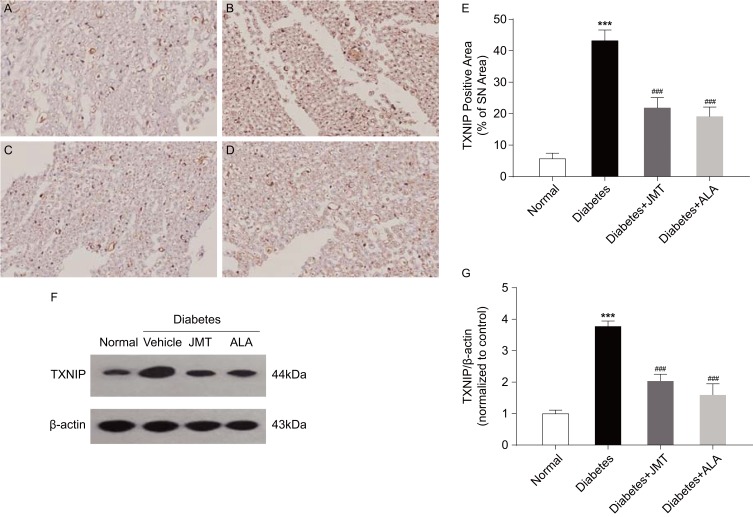
JMT suppressed TXNIP expression in SNs of diabetic rats.
Notes: Representative staining of TXNIP (magnification, ×400) (A–D). Brown color corresponds to protein of interest, and blue color corresponds to nuclear staining. Normal control (A), Diabetes (B), Diabetes + JMT (C), Diabetes + ALA (D). Quantitative analysis of positive-stained areas relative to total tissue areas (E). Representative Western blot images of TXNIP (F). Densitometric analysis of TXNIP/β-actin protein expression normalized to the normal control group (G). Data are the mean ± SEM from three independent experiments. ***P < 0.001 vs normal group, ###P < 0.001 vs diabetes group.
Abbreviations: JMT, Jinmaitong; TXNIP, thioredoxin-interacting protein; SN, sciatic nerve; ALA, alpha-lipoic acid; SEM, standard error of mean.

