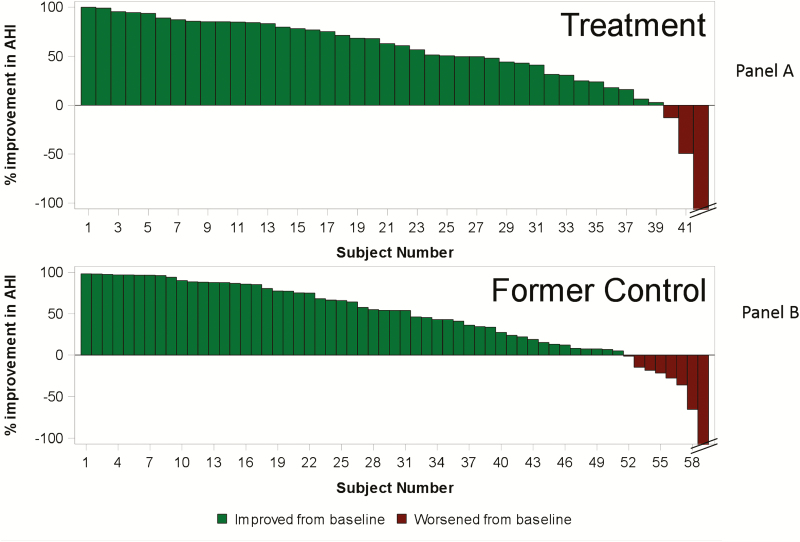
Figure 3.
Percentage change in AHI after 24 months of therapy for each treatment group patient (panel A) and 18 months of active therapy for each former control group patient (panel B). Panel A: The improvements represent the percentage change in AHI from baseline to 24 months of active therapy for each patient in the treatment group. Patients with any decrease in AHI from baseline are shown in green bars and patients with any increase in AHI from baseline are shown in red bars. Panel B: The improvements represent the percentage change in AHI from baseline (prior to therapy activation) to 18 months of active therapy for each patient in the former control group. Patients with any decrease in AHI from baseline are shown in green bars and patients with any increase in AHI from baseline are shown in red bars.

