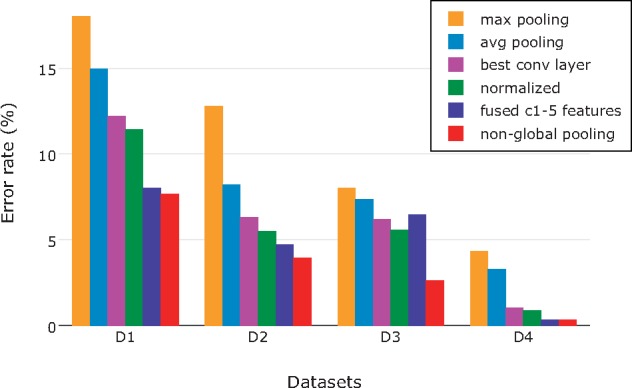
Figure 6.

Reduction in error rate throughout our optimization steps, using input images of size  . The minimum error rates (and top identification accuracies) for D1–D3 were achieved after applying nonglobal feature pooling in the last step (red bar). Note the drastic improvement that came with nonglobal feature pooling in D3, the most fine-grained data set studied here. The best result for D4 was achieved already in the penultimate step, by fusing globally pooled features from c1 to c5.
