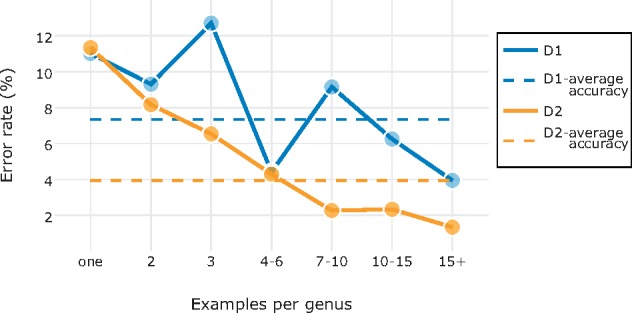
Figure 8.

Effect of sample nature on identification accuracy. Scatter plot of identification accuracies against the number of example images per genus for all families from D1 and D2. The more examples there were on average of each genus in the family, the more likely it was that the model had seen something similar to the image being classified, lowering the misclassification rate.
