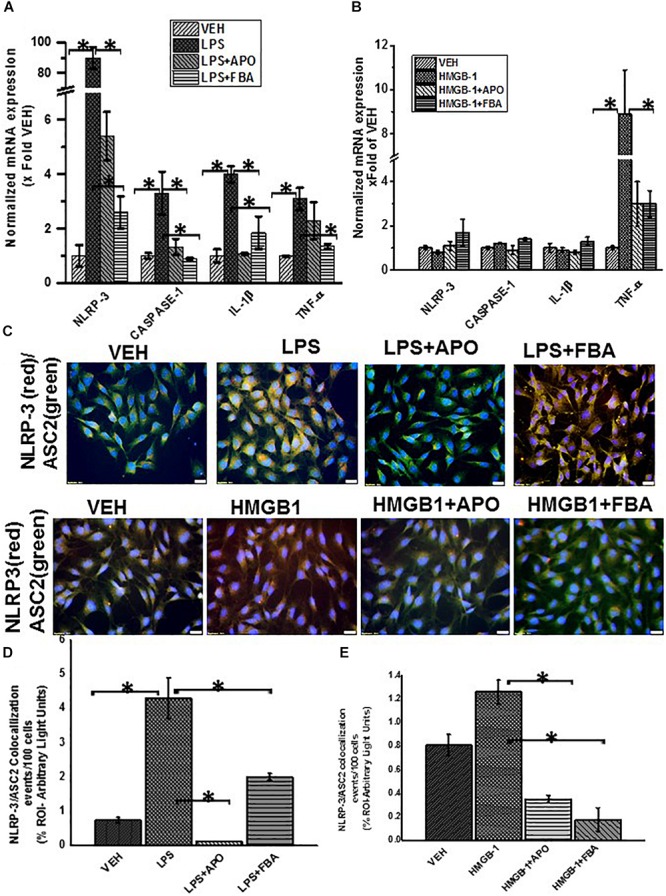
FIGURE 13.

ROS mediated activation of NLRP-3 inflammasome and inflammation in EGC. (A,B) Quantitative real time PCR (qRT-PCR) analysis of inflammasome and inflammation (n = 6). mRNA expression of NLRP-3, caspase-1, IL-1β and TNF-α in rat EGC which were treated with vehicle (VEH), LPS + apocynin (LPS + APO), LPS + phenylboronic acid (LPS + FBA), HMGB-1, HMGB-1 + APO. mRNA expression is represented as a fold change of the vehicle control. Data points are represented as mean ± SEM (n = 3) (∗P > 0.05). (C) NLRP-3/ASC2 protein expression in rat EGC assessed by immunofluorescence microscopy and viewed at total magnification 400X; scale 20 μm). Colocalization events were determined for every 100 cells per field in cells treated with LPS, LPS + APO, LPS + FBA, HMGB-1, HMGB-1 + APO, HMGB1 + FBA. (D,E) Quantitative morphometric analysis of fluorescence intensity of NLRP-3/ASC2. Fields for morphometric analysis were randomly selected from different fields per slide and represented as% region of interest (% ROI) (∗P < 0.05).
