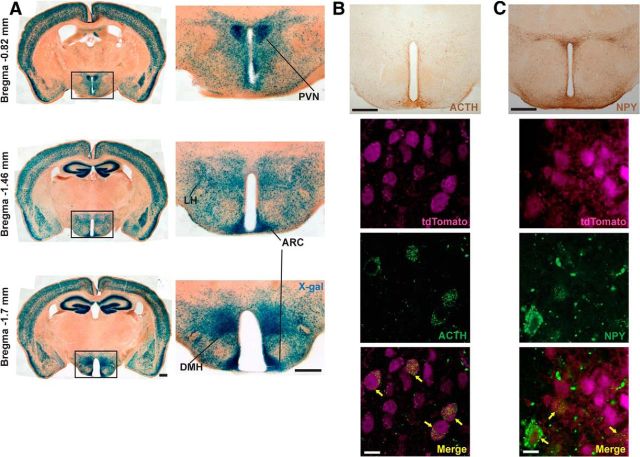
Figure 1.
Recombination in the CamKCreERT2 line. A, X-gal staining of the forebrain in Rosa-LacZCaMKCreERT2 mice after 10 injections of TAM. Images on the left represent overviews of the brains at indicated levels related to the bregma. Relative hypothalamic recombination is shown on the right. B, C, Top, Overview of adrenocorticotropin (ACTH), a cleavage product of POMC, or NPY, immunoreactivity within the hypothalamus, respectively. Bottom, Colocalization (arrows) of ACTH or NPY signals with tdTomato in tdTomatoCaMKIICreERT2 line. Scale bars: A, B, top, C, top, 500 μm; B, bottom, C, bottom, 10 μm.

