Figure 2.

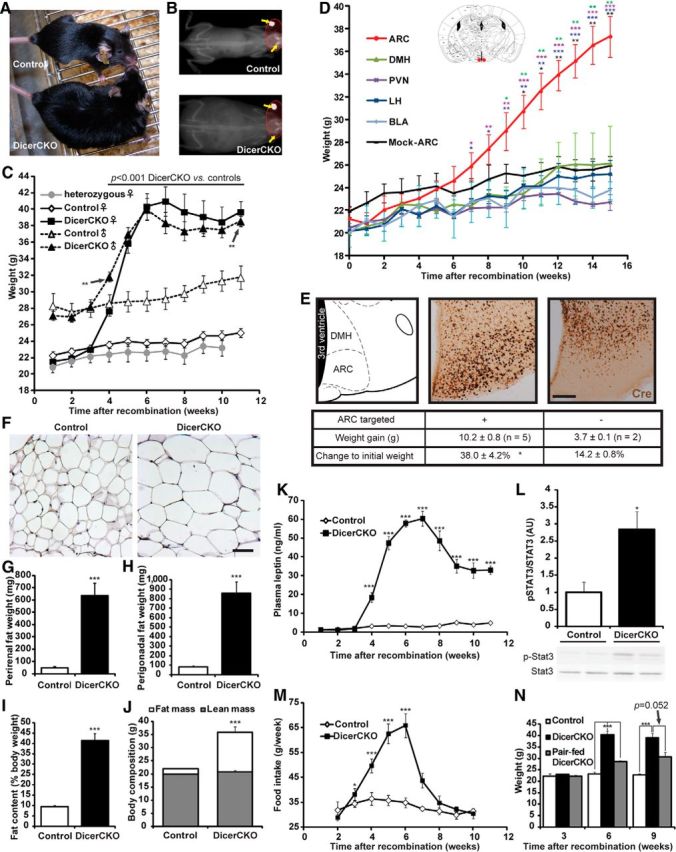
Dicer loss in the ARC leads to obesity. A, B, Light (A) and x-ray (B) photographs of DicerCKO and control littermates 6 weeks after TAM treatment. C, Weight in control, DicerCKO, and heterozygous mice. n = 14, 14, and 4, respectively, for females and n = 12 and 7, respectively, for males. p values (separate for females and males) are outlined above the graphs unless otherwise depicted with asterisks. D, Weight of Dicerfl/fl females, which received 140 nl/site rAAV-Cre bilaterally into ARC (red dots in the scheme above; Paxinos and Franklin, 2001) and other brain regions. The differences between the ARC group and other hypothalamic nuclei groups are depicted with asterisks of respective colors. E, Examples of correct (middle) and incorrect (right) targeting of ARC (atlas plane, left) by 10 nl scale volumes of rAAV-Cre resulting in increased or unchanged body weight in males, respectively, shown by Cre immunostaining. See Table 1 for additional information about injection coordinates and numbers of animals per group. F, Hematoxylin and eosin staining of perigonadal adipose tissue in DicerCKO and control littermates 6 weeks after recombination. G, H, Perirenal and perigonadal fat weights in DicerCKO (n = 4) and control (n = 5) animals at the same time point, respectively. I, J, Quantification of body fat content in DicerCKO (n = 4) and control (n = 5) animals measured by x-ray densitometry. The representative images are shown in B. K, Plasma leptin concentrations in DicerCKO females (n = 5). L, Abundance of hypothalamic Tyr705-phosphorylated form of Stat3 (pStat3) protein in DicerCKO females and representative Western blot below the graph (n = 4). M, Dynamics of food intake in control and DicerCKO females (n = 8 and 9, respectively). N, Weight of pair-fed DicerCKO females (n = 4). Scale bars: E, 250 μm; F, 100 μm.
