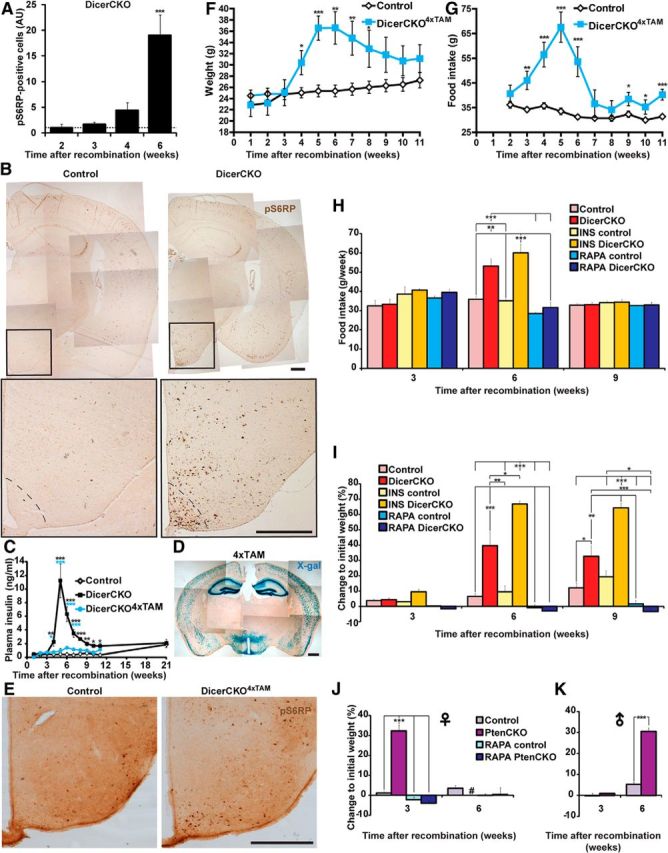
Figure 5.

Enhanced PI3K-Akt-mTOR signaling causes obesity. A, B, Quantification (A) and representative microphotographs (B) of phospho-Ser235/236-S6 ribosomal protein (pS6RP) immunoreactivity in ARC of DicerCKO mice 6 weeks post-TAM (n = 4). C, Plasma insulin levels in the mice treated with 4 (DicerCKO4×TAM) or 10 (DicerCKO) injections of TAM and controls (n = 10, 5, and 5, respectively). D, X-gal staining of the forebrain in Rosa-LacZCaMKCreERT2–4×TAM mice. E, Phospho-Ser235/236-S6 ribosomal protein (pS6RP) immunoreactivity in ARC of DicerCKO4×TAM mice 6 weeks post-TAM. F, Weight in control and DicerCKO4×TAM females (n = 8 and 5, respectively). G, Food intake in control and DicerCKO4×TAM females (n = 9 and 5, respectively). H, I, Control and DicerCKO males were treated daily with either insulin (INS; n = 3) or rapamycin (RAPA; n = 4 and 3, respectively). Food intake (H) and weight (I) are presented. n = 5 and 4 for controls and DicerCKO mice in nontreated groups. J, K, Weight of control and PtenCKO female (J, n = 8 and 6, respectively) and male (K, n = 11 and 2, respectively) mice. Additionally, control and mutant females were treated with RAPA (n = 9 and 10, respectively). #, All PtenCKO females died between third and sixth weeks after TAM treatment. Scale bars: B, D, E, 500 μm.
