Figure 8.

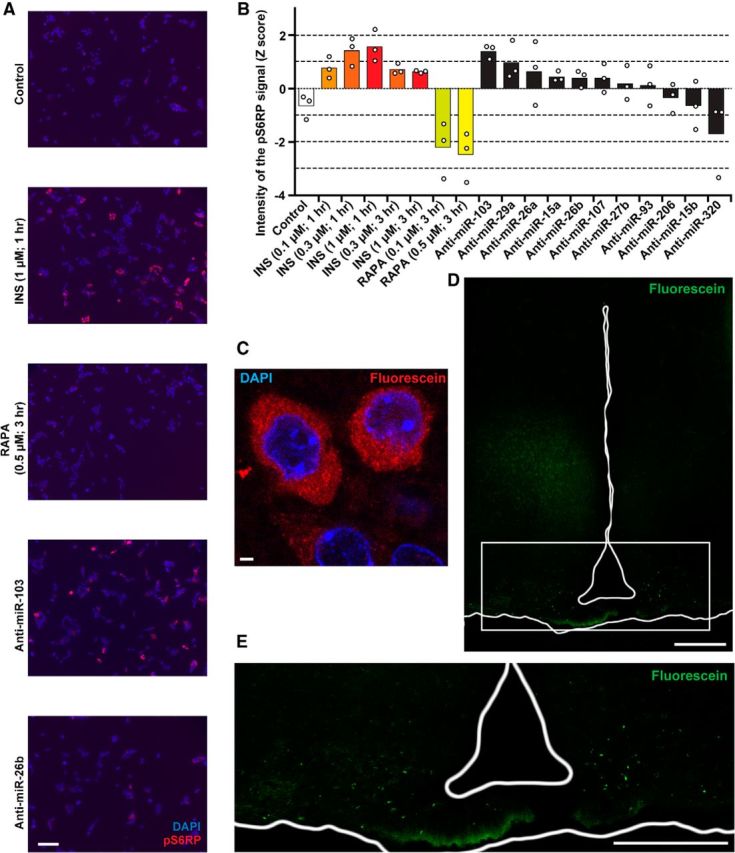
Modulation of microRNA expression in vitro and in vivo. A, B, Representative microphotographs (A) and quantification (B) of HeLa cells transfected with indicated anti-miRNAs or treated with insulin (INS) or rapamycin (RAPA; n = 3). C, Incorporation of the FAM-fluorescein-labeled oligonucleotides into the neurons of the ARC 2 d after the injection, determined by anti-FAM antibody conjugate. D, E, Overview of the hypothalamus (D) and its ventral part (E) clearly showing deposition of LNA-stabilized oligonucleotides in the ARC. The signal represents direct FAM fluorescence 2 weeks after injection (i.e., 6 weeks post-TAM). In both experiments, the fluorescent moiety was attached to the 3′ end of the passenger strand of miR-26b. Scale bars: A, 100 μm; C, 2 μm; D, E, 200 μm.
