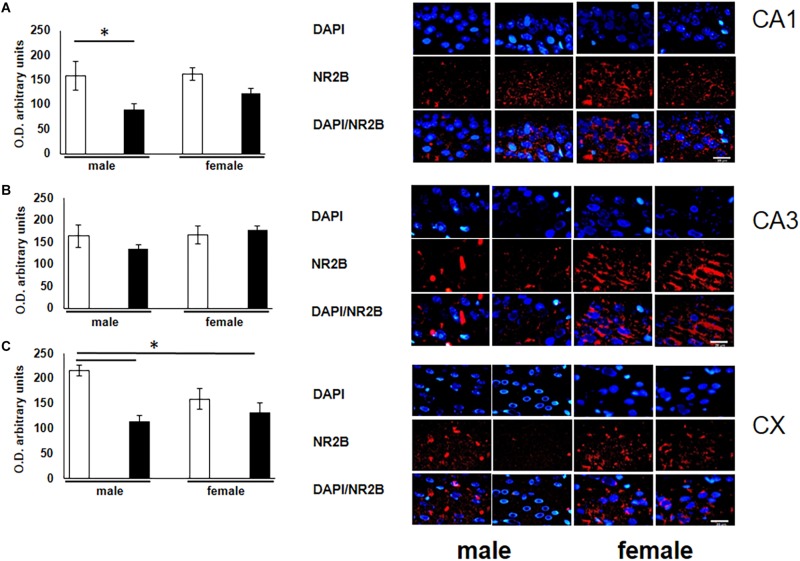
FIGURE 2.
Representative microphotography (objective 60× and zoom 1.6×) showing immunopositivity for the NR2B subunit of the NMDA receptor (red) and DAPI-stained nuclei (blue). The graph indicates optical density arbitrary units for control group (white bars) and ozone group (black bars) in males and females, (A) CA1, (B) CA3 and (C) CX. We observed a decrease in the expression of NR2B in three structures (CA1, CA3, and CX), when compared with their respective controls. Bars indicate the mean ± SEM, using one-way ANOVA comparison statistics. ∗P ≤ 0.05. Scale bar = 20 μm.

