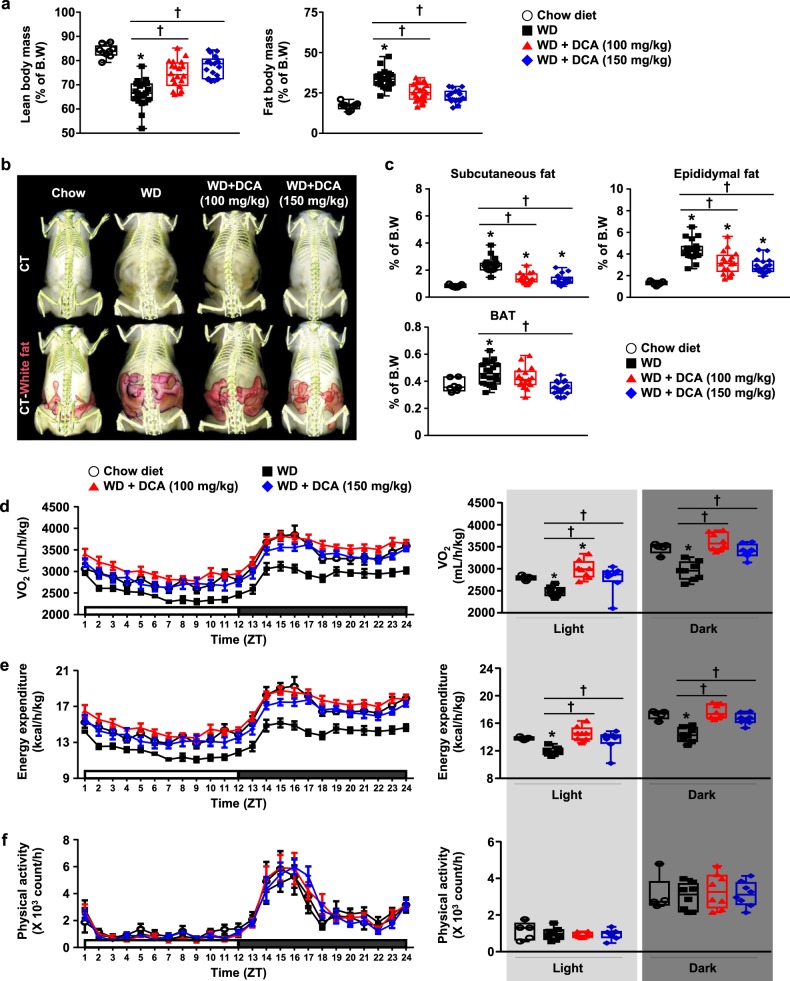
Fig. 2. DCA leads to reduced adiposity and higher energy expenditure in WD-fed ApoE−/− mice.
a Body compositions of mice ascertained by Minispec (chow-fed group, n = 9; WD-fed group, n = 19–21). b Body composition analysis of mice by micro-CT. Visceral fat tissue is highlighted in pink. c Fat tissue weight (chow-fed group, n = 7; WD-fed group, n = 17–20). d–f Metabolic parameters of the mice. The levels of VO2 (d), energy expenditure (e), and physical activity (f) (chow-fed group, n = 5; WD-fed group, n = 8). The values are expressed as the mean ± SEM. Statistical analysis was performed by Student’s t-test. *p < 0.05 vs. the chow-fed group, †p < 0.05 vs. the WD-fed group

