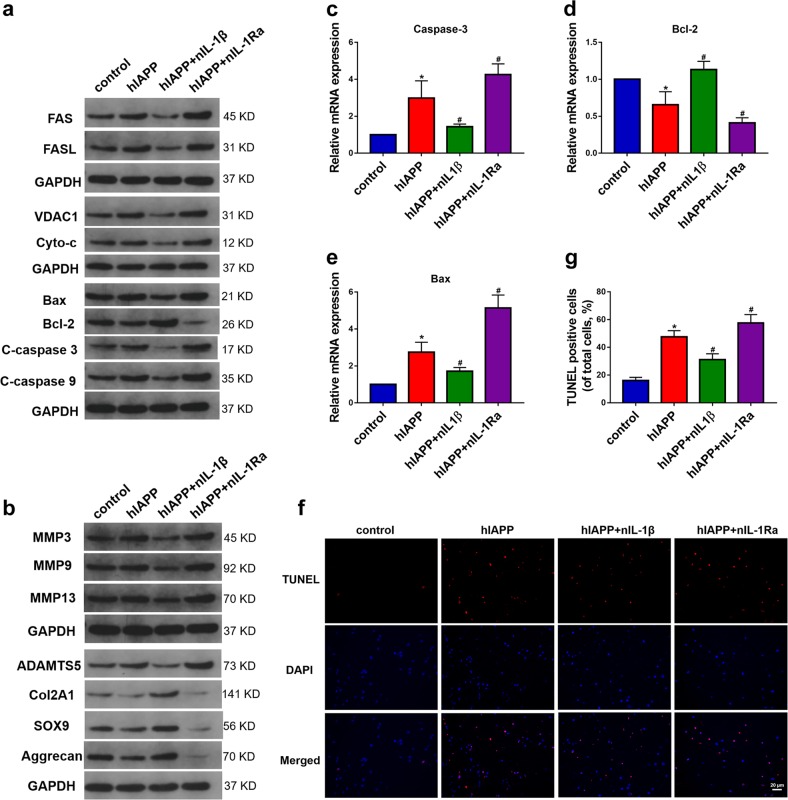
Fig. 4. The effects of hIAPP aggregation on cell apoptosis and ECM metabolism ex vivo.
a Western blot analysis was used to evaluate the protein expression of FAS, FASL, VDAC1, Cyto-c, Bax, Bcl-2, cleaved caspase-3, and caspase-9. GAPDH was used as an internal control. b Western blot analysis was used to evaluate the protein expression of MMP3, MMP9, MMP13, ADAMTS5, COL2A1, SOX9, and aggrecan. GAPDH was used as an internal control. c–e The mRNA expression levels of Bax c, Bcl-2 d and caspase-3 e were measured by RT-qPCR. β-actin was used as an internal control. f–g Representative images of TUNEL analysis f and the quantitative analysis of the TUNEL-positive cell rate g. The data are presented as the mean ± SD (n = 3). *P < 0.05 vs. the control group. #P < 0.05 vs. the hIAPP group

