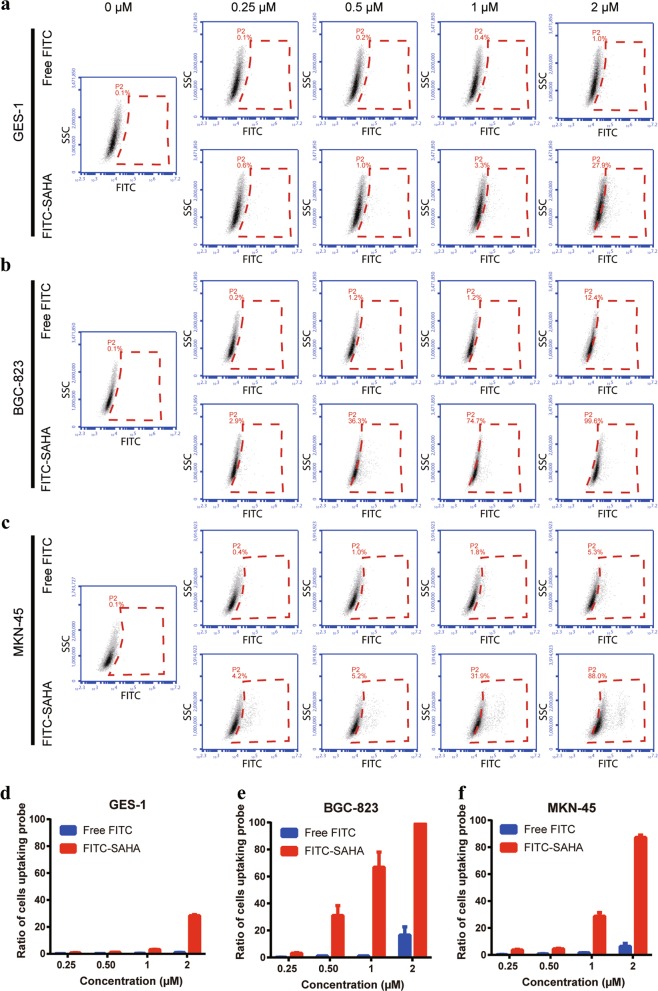
Fig. 2. Binding capacity and affinity of SAHA for GC cells.
a–c The GES-1, BGC-823, and MKN-45 cell lines were incubated with various concentrations of FITC-SAHA for 4 h. Fluorescence was analyzed by flow cytometry. GES-1, BGC-823, and MKN-45 cells treated with various concentrations of free FITC were used as controls. d–f The proportion of positive cells labeled by FITC-SAHA or free FITC was calculated. All experiments were repeated three times

