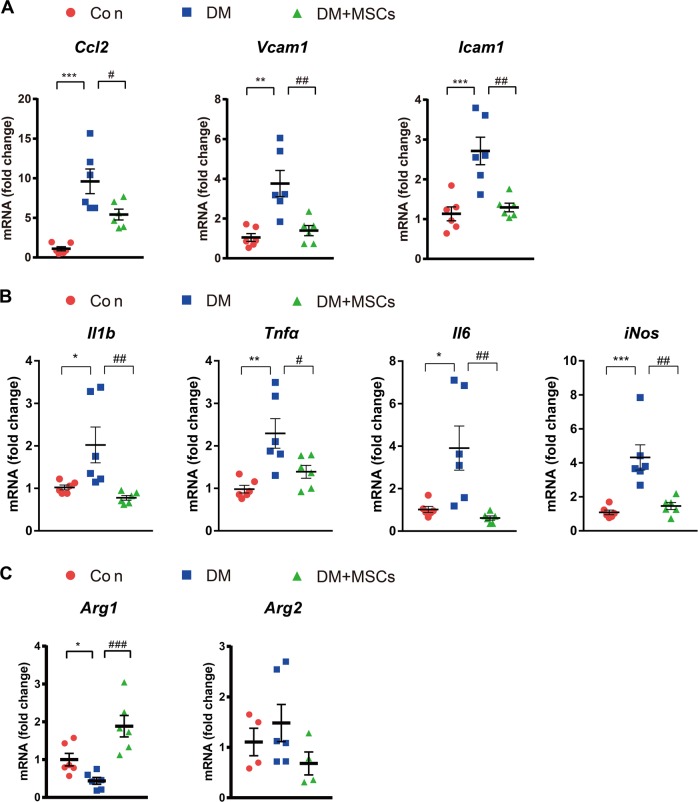
Fig. 2. MSC treatment decreased and increased the expression of M1 macrophages and Arg1, respectively, in diabetic kidneys.
a Real-time RT-PCR analysis of Ccl2, Vcam1, and Icam1 expression in the kidneys. b MSC treatment decreased the expression level of M1 macrophage markers. c MSC treatment increased Arg1 expression, whereas it did not alter Arg2 expression. Con, non-diabetic CD1 mice; DM, diabetic CD1 mice; DM + MSCs, diabetic CD1 mice with MSC treatment. Data show the means ± SEMs of six mice. *P < 0.05, **P < 0.01, and ***P < 0.001 versus Con; #P < 0.05, ##P < 0.01, and ###P < 0.001 versus DM

