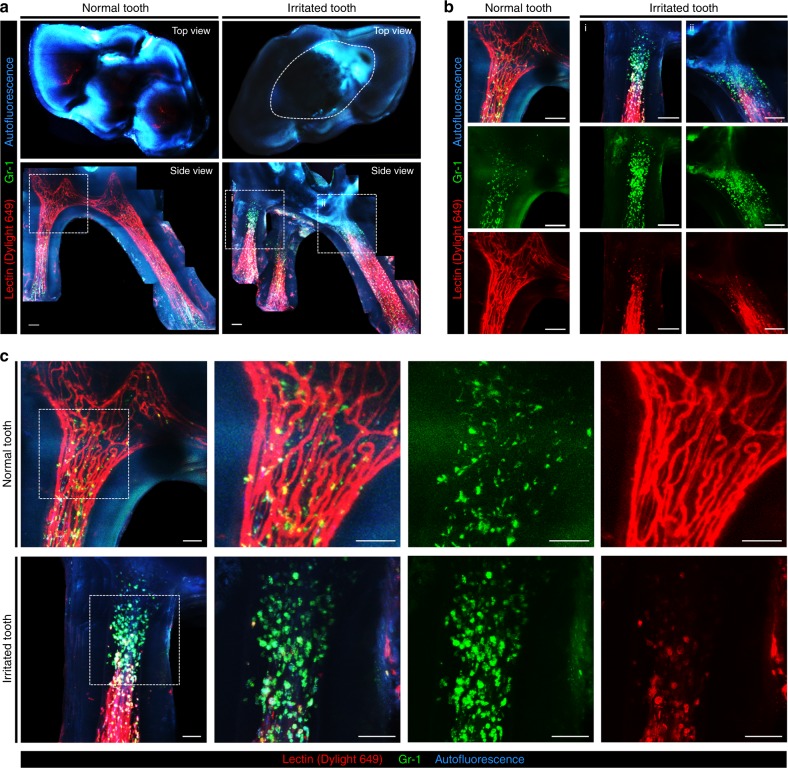
Fig. 3.
3D visualization of granulocyte recruitment and microvasculature changes in the dental pulp of an inflamed mouse tooth. a Top-view and side-view maximal intensity Z-projection image of an extracted normal tooth and a tooth irritated by mechanical burring; blood vessels (red), Gr-1 + cells (green), and autofluorescence (cyan). The burred area was delineated by a dashed line in the top-view image. Scale bar, 100 μm. b Magnified images in dotted squares in a. Scale bar, 100 μm. c Magnified images in dotted squares in a highlight changes in the granulocyte distribution and microvasculature in the irritated tooth. Scale bar, 50 μm

