Figure 2:

Contact matrix generated from the Hi-C data analysis showing sequence interactions in chromosomes. Color bar indicates the logarithm of the contact density.

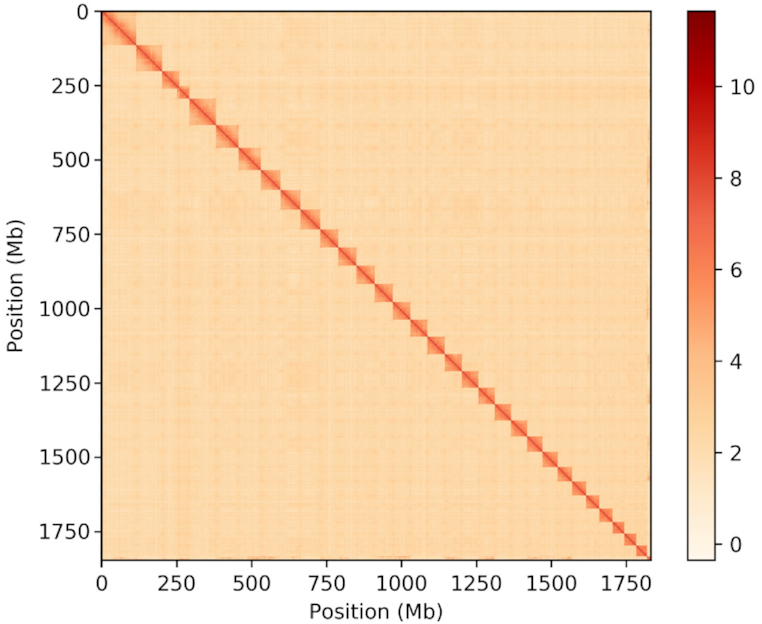
Contact matrix generated from the Hi-C data analysis showing sequence interactions in chromosomes. Color bar indicates the logarithm of the contact density.