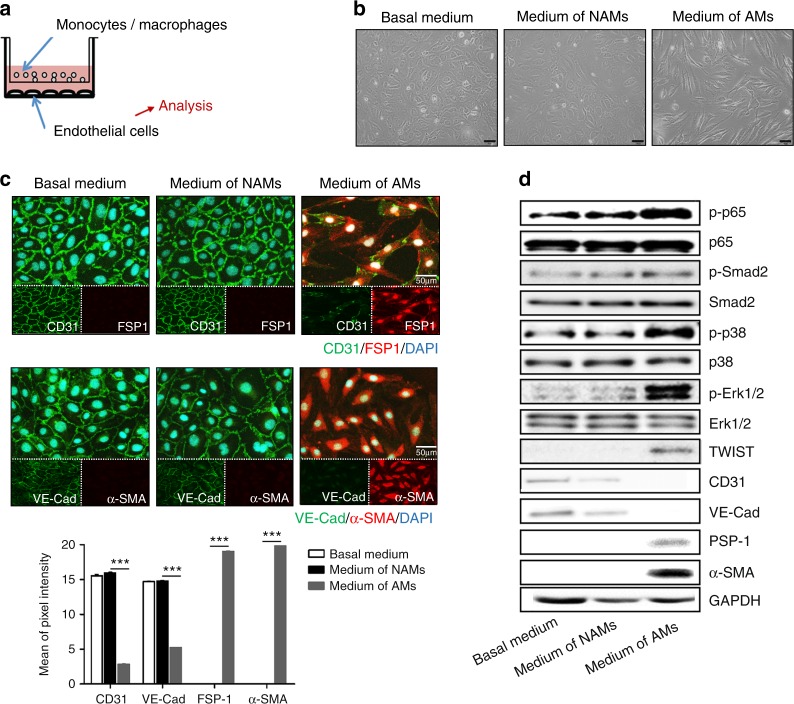
Fig. 7.
Induction of EndMT of HUVECs by macrophages. a Schematic representation in the profile of a co-culture system. THP1 monocytes or THP1-derived activated monocytes were plated in the upper Transwell and, simultaneously, HUVECs were plated on the bottom of the well. b Representative phase-contrast microscopic pictures of HUVECs after 20 h co-culture without monocytes or activated monocytes; non-PMA activated monocytes (NAMs) and PMA activated macrophages (AMs) in the inset. Scale bar: 100 μm. c Representative immunofluorescent images of the expression of CD31 (green), VE-cad (green), FSP-1 (red) and α-SMA (red) in co-cultured HUVECs and quantification of the expression in the images using ImageJ. Nuclei were counterstained with DAPI (blue). Scale bar: 50 μm. d Phosphorylation of EndMT-related signaling molecules such as Smad2, p38, ERK and p65, and protein expressions of CD31, VE-cad, FSP-1 and α-SMA in co-cultured HUVECs. ***P < 0.001 compared with control cells (non-treated cells)

