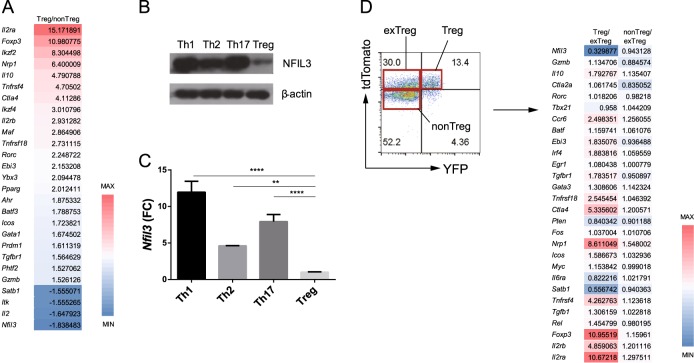
Fig. 1. Nfil3 expression in CD4 T-cell subsets.
a Genes differentially expressed between Treg and non-Treg cells were analyzed by microarray analysis. Red represents increased, and blue represents decreased gene expression levels in Treg cells compared with non-Treg cells. Numbers indicate the fold-change in expression of each gene. b Western blot analysis of NFIL3 protein expression in each CD4 T-cell subset. Naive CD4 T cells were stimulated under Th1, Th2, Th17, and Treg-polarizing conditions for 3 days. β-Actin was used as a control. c Nfil3 mRNA expression in each subset was measured by qRT-PCR. Data are representative of three independent experiments. d Flow cytometry analysis of splenocytes from Foxp3CRE/YFP X Rosa26tdTomato mice (left). Treg (#1), ex-Treg (#2), and non-Treg (#3) cells were sorted as shown. Microarray analysis data showing selected gene expression levels in each group (right). Numbers indicate the fold-change in expression of each gene. Error bars represent the standard deviation (SD). The significance of differences between groups was determined by two-way ANOVA; *P < 0.05, **P < 0.01, ***P < 0.001, and ****P < 0.0001, n.s. not significant

