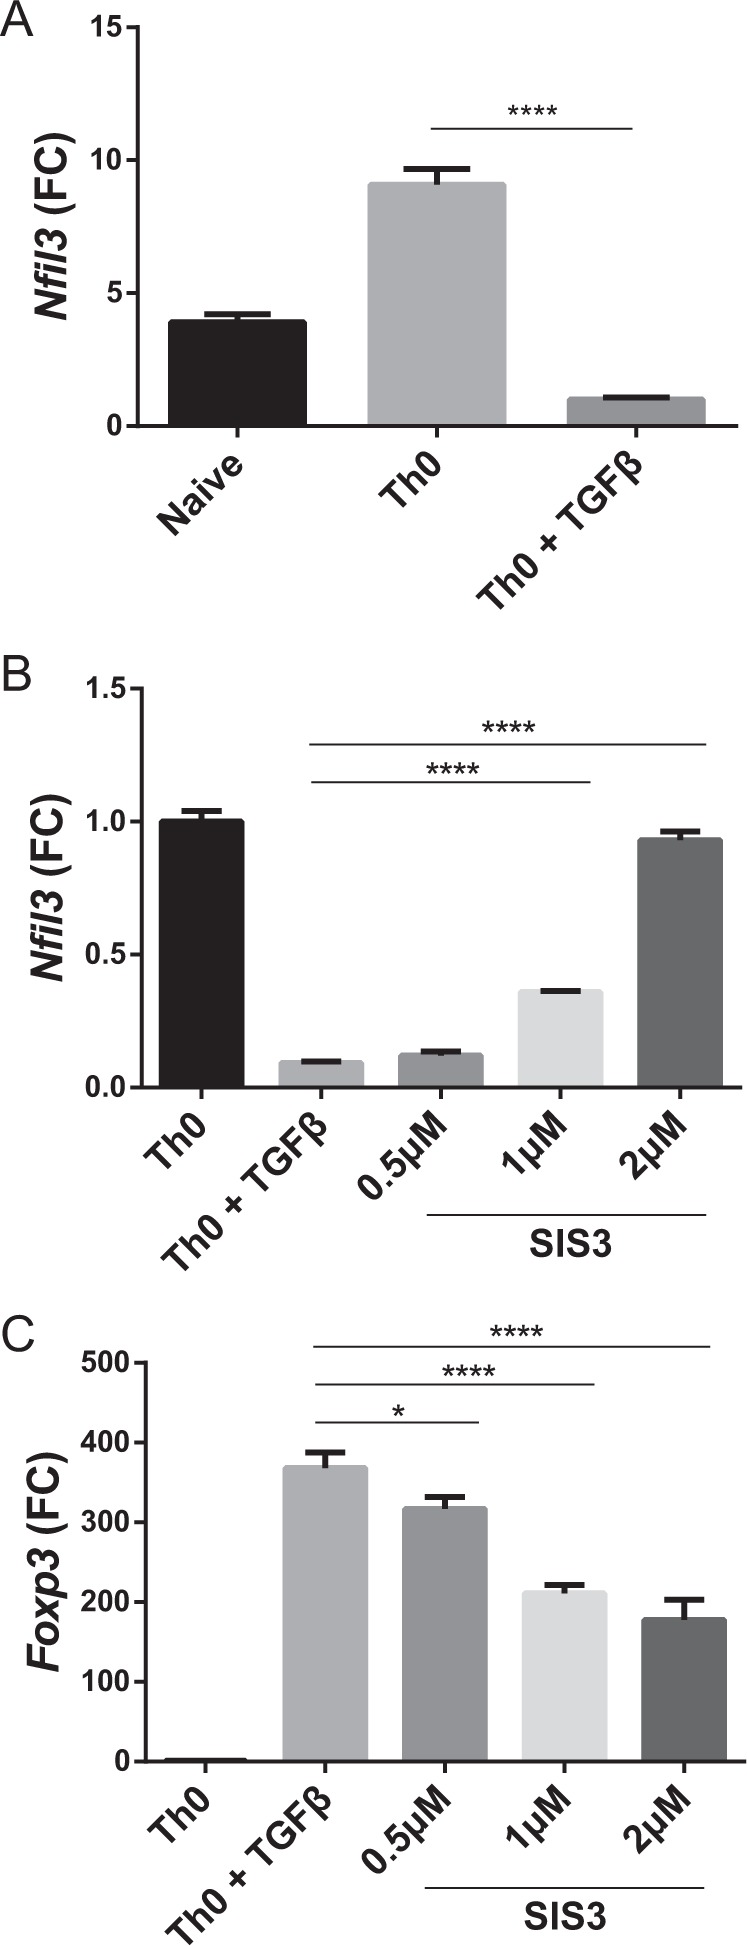
Fig. 2. Nfil3 expression is regulated by the TGF-β/SMAD3 signaling pathway.

a Nfil3 mRNA expression levels in naive CD4 T, Th0, and Th0 + TGF-β cells were determined by qRT-PCR. Cells were cultured with plate-bound anti-CD3 and soluble anti-CD28 antibody for 3 days. TGF-β was added at 5 ng/ml. Levels of Nfil3 (b) and Foxp3 (c) mRNA were measured by qRT-PCR. Cells were cultured with concomitant SIS3 treatment at the indicated concentrations for 3 days. qRT-PCR data are representative of three independent experiments. Error bars represent the SD. The significance of the differences between groups was determined by Student’s t test. *P < 0.05, **P < 0.01, ***P < 0.001, and ****P < 0.0001, n.s. not significant
