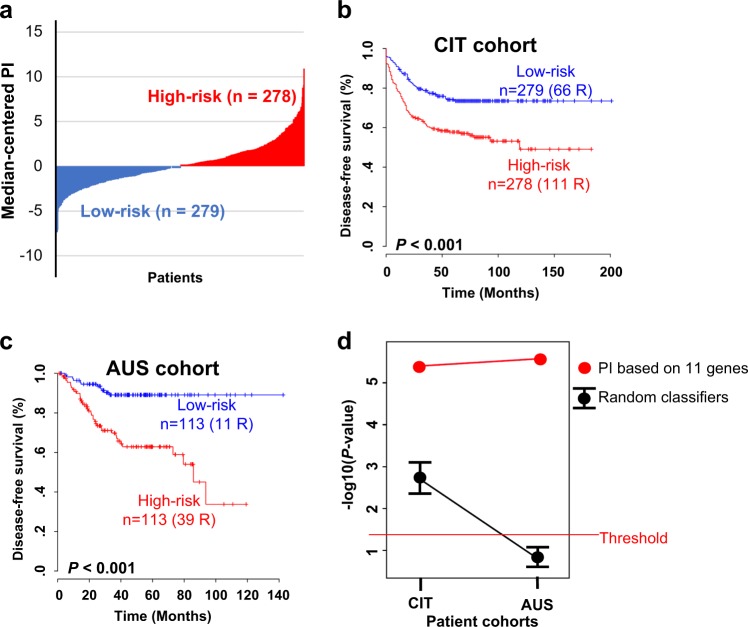
Fig. 2. Colorectal cancer (CRC) patient stratification with the prognostic index (PI).
a Bar-plot of the PI based on the 11 gene signature in the CIT cohort. Each bar indicates the risk score for an individual patient. b Kaplan–Meier curves showing the time to recurrence in the two subgroups in the CIT cohort stratified by the 11 gene-based PI. c Kaplan–Meier curves of the two subgroups in the AUS cohort stratified by the PI derived from the CIT cohort. d Comparison between randomly generated classifiers and the 11 gene-based PI. Confidence interval (CI) plots of P-values obtained using the log-rank test in random classifiers are displayed. Each dot indicates the average P-value. The upper and lower bars indicate the upper and lower values of the 95% CI for significance, respectively. The 95% CI was obtained from 1000 resampling events. Each red dot indicates the significance level of the PI classifier. All values were expressed on a -log10 transformed scale, and the threshold of significance was P < 0.05

