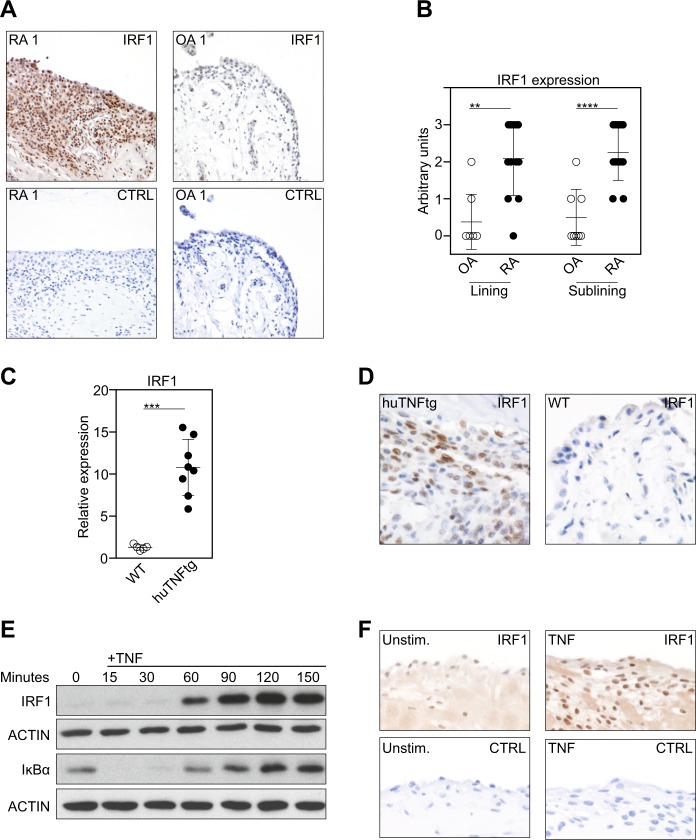
Fig. 1. TNF-induced IRF1 expression in RA-FLSs.
a Representative immunostaining for IRF1 (brown staining) in rheumatoid arthritis (RA) and osteoarthritis (OA) synovial tissue samples (upper panel). Staining with an isotype-matched control antibody (CTRL) is presented in the lower panel. b Synovial tissue samples from 12 RA and 8 OA patients evaluated for IRF1 expression using a semiquantitative score (0 = no staining, 3 = high staining). Lining: Mann–Whitney U test, **p = 0.0016; Sublining: Student’s t-test, ****p < 0.0001. c Quantitative RT-PCR analysis of the IRF1 mRNA levels in hind paws obtained from wild-type (WT) and hTNFtg mice. Mann-Whitney U test, ***p = 0.0008. d Immunohistochemical detection of IRF1 (brown staining) in hind paw tissue from WT and hTNFtg mice. e Western blot analysis of TNF-stimulated (10 ng/ml) RA-FLSs. Blots representative of at least five independent experiments with FLSs from different donors are shown. f RA-FLSs cultured in micromass organ cultures for 7 days in the presence or absence of TNF (10 ng/ml). Micromasses were fixed, sectioned, and stained with hematoxylin and a specific antibody against IRF1 (brown staining). Representative images from three independent experiments performed with FLSs from three RA patients are shown (upper panel). Staining with an isotype-matched control antibody (CTRL) is presented in the lower panel

