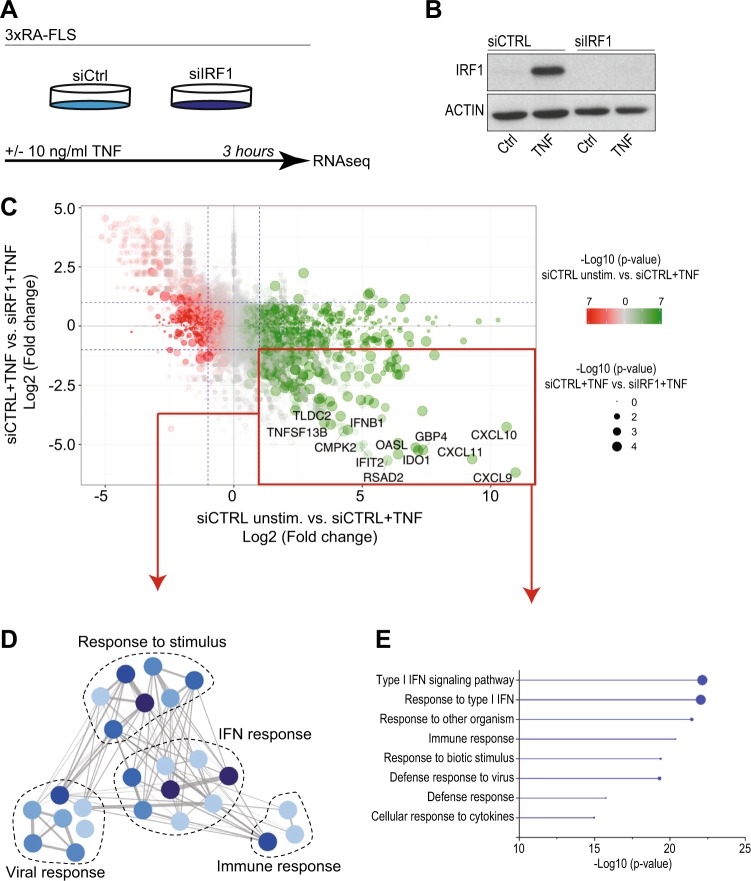
Fig. 2. The TNF-driven interferon response in FLSs depends on IRF1.
a Workflow outlining the RNA sequencing (RNA-seq) experiment. RA-FLSs from three different RA patients were transfected with nontargeting (siCTRL) or IRF1-targeting siRNA pools and stimulated with TNF (10 ng/ml) for 3 h. RNA was isolated and processed for transcriptomic profiling. b Representative immunoblots of IRF1 expression in RA-FLSs after siRNA transfection and stimulation with TNF (10 ng/ml) for 3 h. c Scatter-plot of the RNA-seq data (panel A) showing the impact of IRF1 knockdown on TNF-regulated genes. Dots in the lower right quadrant (red box) represent genes with expression upregulated by TNF, but impaired by the siRNA-mediated knockdown of IRF1 expression. Dashed blue lines indicate a twofold change in gene expression. d Network analysis of GO term (biological process, BP) enrichment among significantly regulated TNF-IRF1-dependent genes (as depicted in panel C, red box). The resulting network was calculated and visualized using EnrichmentMap. Groups of similar GO terms were manually circled. Line thickness is proportional to the similarity coefficient between the connected nodes. Node color is proportional to the FDR-adjusted P-value of the enrichment. e Enriched GO terms (BP, top 8) of the genes within the bottom right quadrant (red box) in the scatter-plot (Fig. 2c). Circle size shows the relative amount of significant genes associated with the GO term

