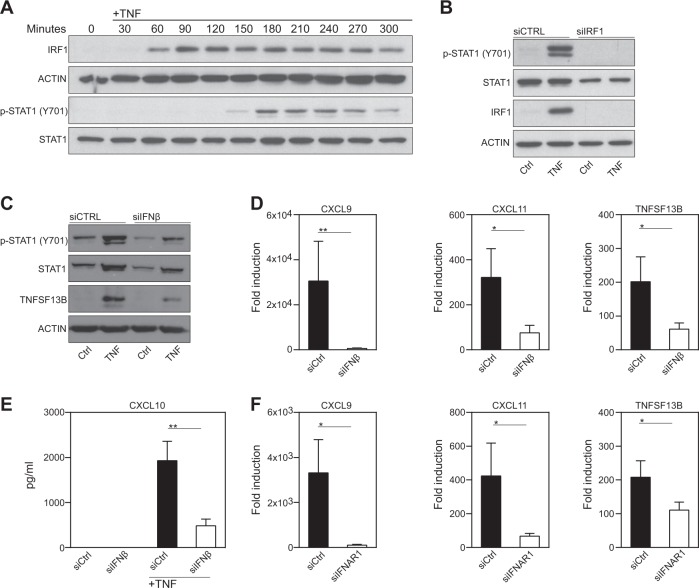
Fig. 4. The TNF-induced interferon response in FLSs depends on IRF1.
a Western blot analysis of IRF1 expression and STAT1 phosphorylation in TNF-stimulated (10 ng/ml) FLSs. Blots representative of three independent experiments with different RA-FLS cell lines are shown. b Western blots showing the IRF1 expression and STAT1 phosphorylation in TNF-treated (10 ng/ml; 3 h) RA-FLSs that were transfected with either nontargeting or IRF1-targeting siRNA pools. Blots representative of three independent experiments with FLSs from different RA donors are shown. c–e FLSs were transfected with nontargeting (siCTRL) or IFNβ-targeting siRNA pools and then stimulated with TNF (10 ng/ml). c Transfected FLSs stimulated with TNF for 24 h. Western blots representative of at least four experiments performed with different RA-FLS cell lines are shown. d Transfected FLSs from seven donors with RA treated with TNF (10 ng/ml) for 6 h. Gene expression was determined by qPCR. Expression in the treated cells is presented relative to that in the unstimulated cells. Values are shown as the mean ± SEM. *p < 0.05, **p < 0.01; Wilcoxon matched-pairs test. e Transfected RA-FLSs from seven different donors suffering from RA treated with TNF (10 ng/ml) for 24 h. Supernatants were analyzed for CXCL10 expression by ELISA. Values are shown as the mean ± SEM. **p < 0.01, Wilcoxon matched-pairs test. f FLSs (n = 6) transfected with nontargeting (siCTRL) or IFNAR1-targeting siRNA pools and then stimulated with TNF for 6 h. Gene expression was determined by qPCR. Expression in the treated cells is presented relative to that in the unstimulated cells. Values are shown as the mean ± SEM. *p < 0.05, Wilcoxon matched-pairs test. Western blots representative of at least four experiments with different RA-FLS cell lines are shown

