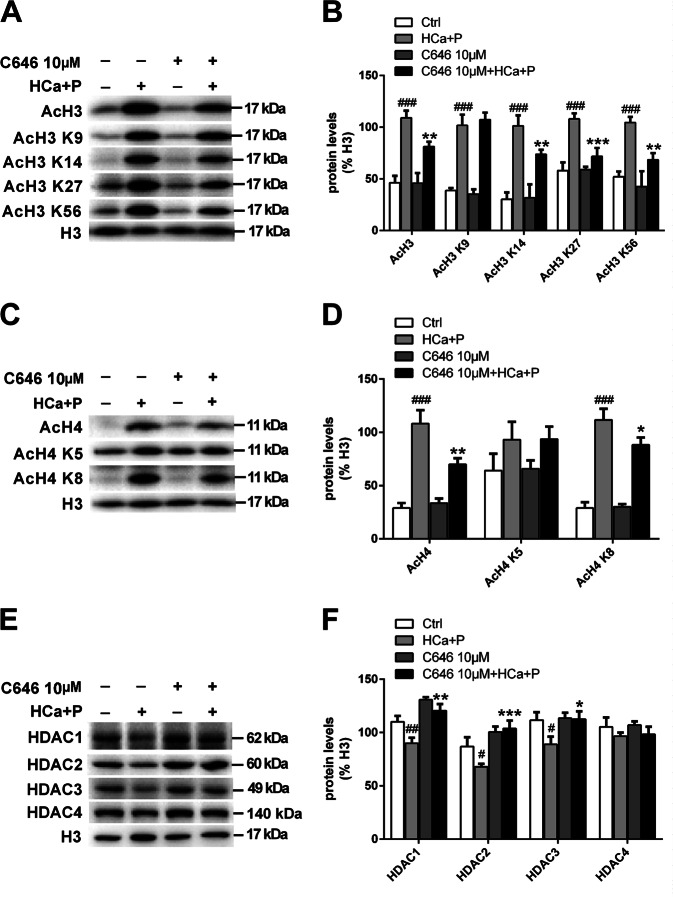
Fig. 4. HAT activity in pAVICs treated with high calcium/high phosphate.
a, b The expression of AcH3, AcH3 K9, AcH3 K14, AcH3 K27, and AcH3 K56 was assessed by western blotting. The relative protein levels were normalized to H3. c, d The expression of AcH4, AcH4 K5, and AcH4 K8 was assessed by western blotting. The relative protein levels were normalized to H3 levels. e, f The expression of HDAC1, HDAC2, HDAC3, and HDAC4 was assessed by western blotting. The relative protein levels were normalized to H3 levels. The data are shown as the means ± standard errors of the means of triplicates and are representative of three independent experiments performed. (#p < 0.05, ##p < 0.01, ###p < 0.001 compared with control; *p < 0.1, **p < 0.01, ***p < 0.001 compared with high Ca+P)

