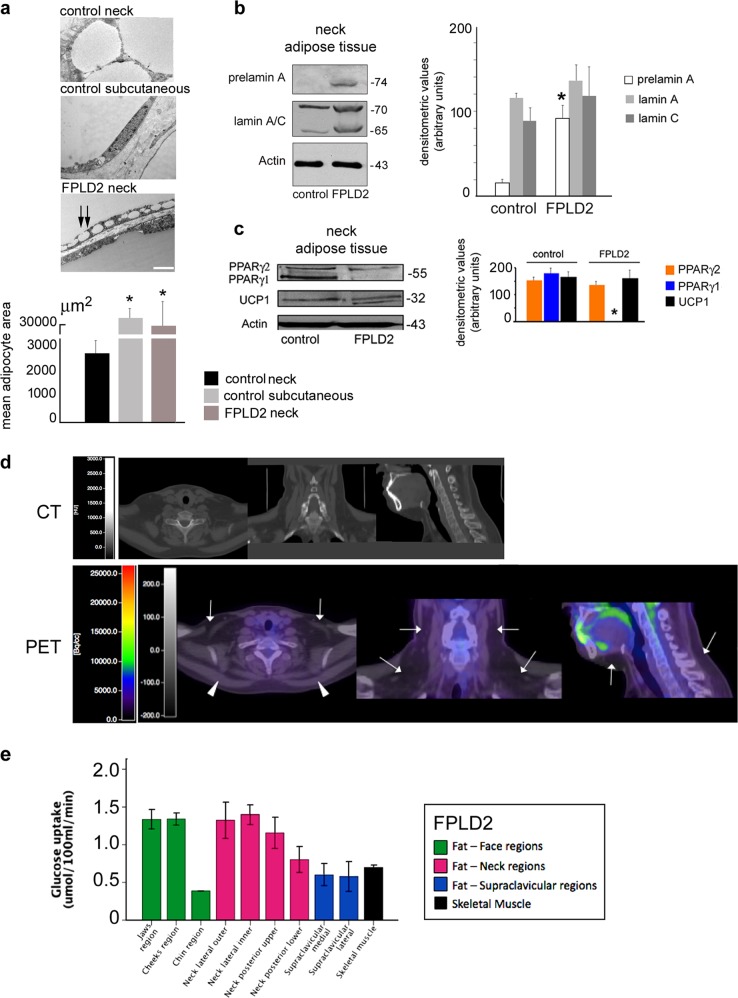
Fig. 5. Neck FPLD2 adipose tissue shows an intermediate brown/white phenotype and absence of BAT activity.
Characterization of adipose tissue isolated from the neck district of healthy donors (control neck), subcutaneous tissue from the leg of healthy donors (control subcutaneous), and FPLD2 patients neck (FPLD2 neck) is shown in a–c. a Electron microscopy analysis of control and FPLD2 adipose tissue. Small lipid droplets fusing to a large droplet are indicated by double arrows. Bar, 2 μm. The mean adipocyte area is reported in the graph. Statistically significant differences relative to control neck tissue are indicated (*). b Western blot analysis of prelamin A and lamin A/C in control and FPLD2 adipose tissue, and densitometric analysis. Statistically significant differences between control and FPLD2 tissue samples are indicated (*). c Western blotting analysis of PPARγ and UCP1 in control and FPLD2 adipose tissue and densitometric analysis. Statistically significant differences between control and FPLD2 tissue samples are indicated (*). In b and c: actin band is shown as a protein-loading control; molecular weight markers are reported in kDa. Cold-induced fat 18F-2-fluoro-2-deoxy-D-glucose (18F-FDG) uptake in the supraclavicular regions, face, neck, and skeletal muscle of FPLD2 patients is shown in d, e. d Representative CT and CT-PET images referring to one out of three examined FPLD2 patients are shown. e Levels of cold-induced glucose uptake (18F-2-fluoro-2-deoxy-D-glucose (18F-FDG) uptake) in fat depots of the face, neck supraclavicular regions, and trapezius muscle (skeletal muscle) of FPLD2 patients. Data are means ± SD

