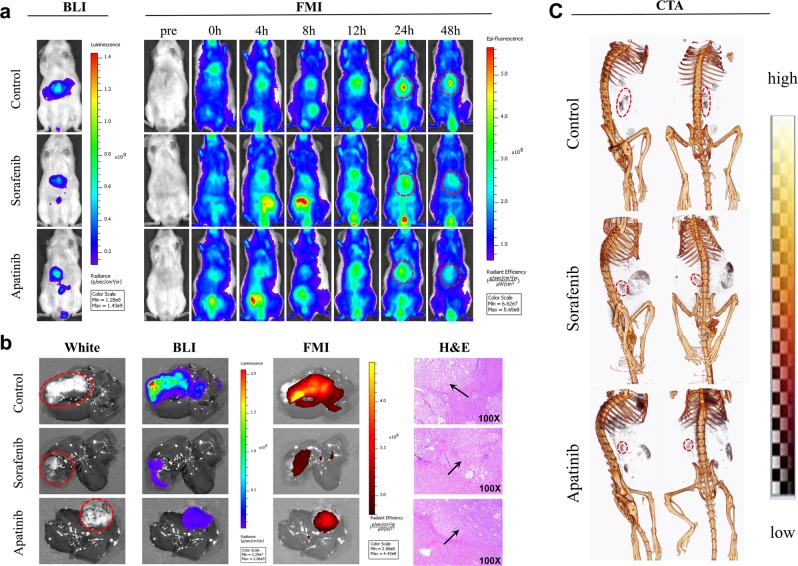
Fig. 4. BLI, FMI, and CTA in orthotopic liver tumor-bearing mice on day 20 post-drug treatment (n = 3).
a In vivo BLI and FMI of control and sorafenib and apatinib treatment groups at the time points of pretreatment and 0, 4, 8, 12, 24, and 48 h post-treatment of AngioSense 750 EX. b Ex vivo white light imaging, BLI, and FMI livers from mice and H&E staining of liver tumor specimens at 48 h post-treatment with AngioSense 750 EX. Black arrows indicate tumor tissues. c The 3D CTA in the control and sorafenib and apatinib treatment groups 15 min after Fenestra VC injection. The red dotted line denotes tumor blood vessel areas

