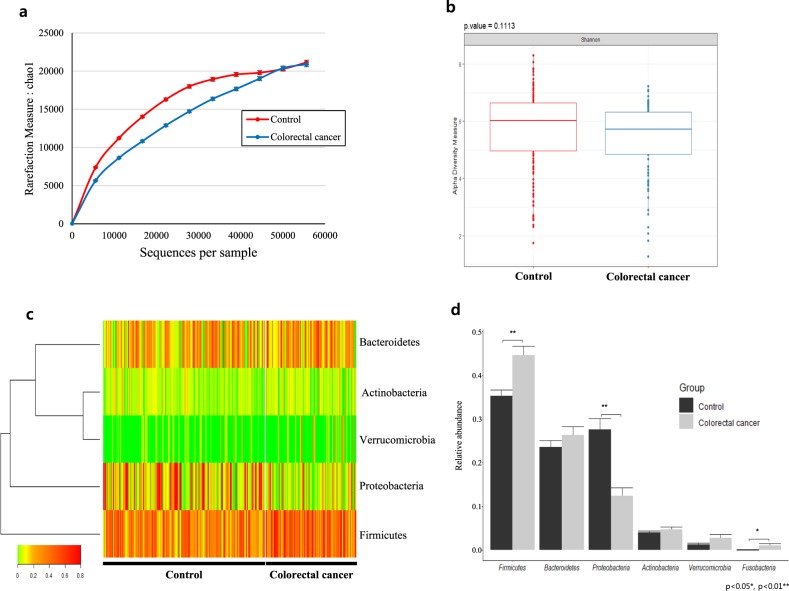
Fig. 1. Alpha diversity and phylum-level gut microbiota composition.
a Estimated species richness (Chao1 measure) and b alpha diversity defined by Shannon’s index. c Heatmap of the gut microbiota at the phylum level, with columns representing individual control and CRC stool samples and rows corresponding to the identified phyla. Color scale based on relative OTU abundance, and hierarchical clustering based on Euclidean distance. d Average relative abundance of individual phyla, with error bars representing the standard error (SE). Significance between groups assessed by a t test (* = Ad. p < 0.05, ** = Ad. p < 0.01)

