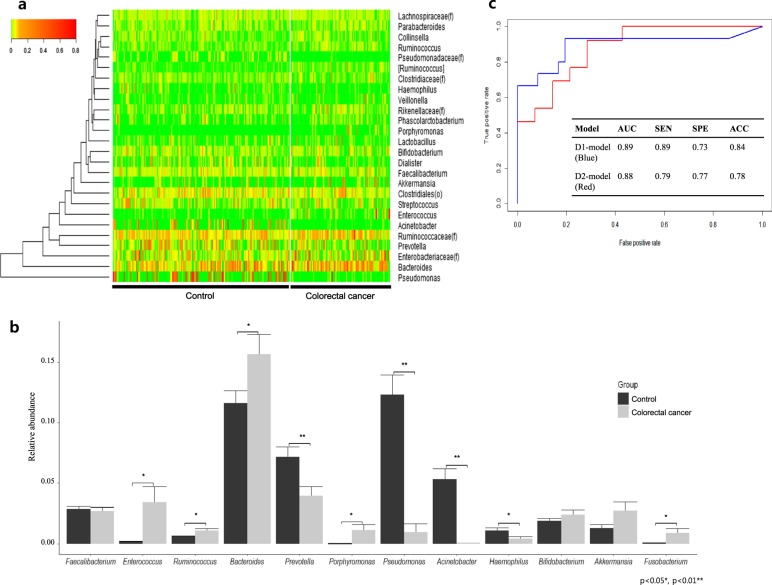
Fig. 3. Genus level gut microbiota composition and CRC diagnostic prediction model.
a Heatmap and clustering of individual control and CRC samples with a color scale indicating relative abundance at the genus level and hierarchical clustering measured by Euclidean distance. b Bar graph displaying the relative abundance of select genera and error bars showing the standard error (SE). Significance between control and CRC groups determined through Student’s t test (* = Ad. p < 0.05, ** = Ad. p < 0.01). c ROC curves of CRC diagnostic prediction models developed through stepwise selection of significantly altered genera (D1-model) and two increased and two decreased genera (D2-model). Models were validated by a 10-fold cross-validation method to assess the area under the curve (AUC), sensitivity, specificity, and accuracy of each model

