Fig. 3.
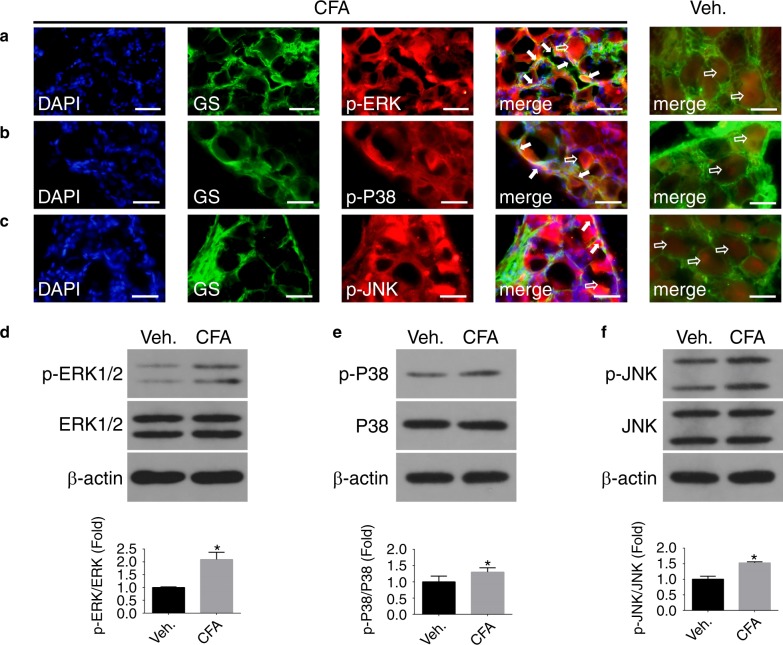
The expression of p-MAPKs in vivo after vehicle administration and 24 h after CFA injection. a–c IF staining of p-MAPKs in rat TG slices in the vehicle and CFA groups. Arrows (solid) show that p-MAPKs co-localized with GS, and arrows (hollow) show that p-MAPKs localized in TG neurons (green: GS; red: p-ERK1/2, p-P38, and p-JNK; blue: DAPI). Scale bars: 50 μm. WB images and graphs in d–f show that the expression of p-ERK1/2, p-P38 and p-JNK in CFA-treated TGs is higher than that in vehicle TGs, and these levels were normalized against their total levels. (n = 6, *P < 0.05 compared with the vehicle group)

